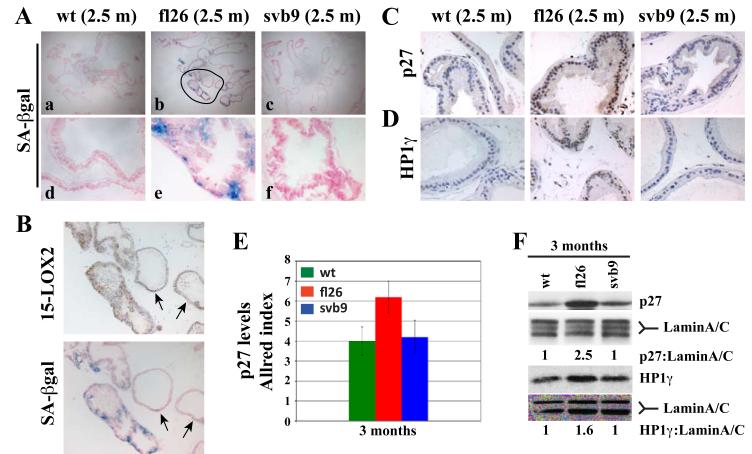
Figure 5. Transgenic expression of 15-LOX2 leads to early induction of senescence.
(A) Fresh whole-mount cryosections of wt and transgenic VPs at 2.5 mo. were stained for SA-βGal. Shown are images (40x, upper panels; 400x, lower panels) representative of 3-5 animals analyzed from each genotype/age group.
(B) SA-βgal staining correlates with the transgene expression. The encircled area in fl26 (2.5m) in A was enlarged to show matched SA-βgal and 15-LOX2 staining. Note a good correlation between SA-βgal positivity and transgene expression. The two arrows indicate the glands that show weak staining for 15-LOX2 and correspondingly the lack of SA-βgal staining.
(C-D) Whole-mount paraffin sections of wt and transgenic VPs at 2.5 mo. were used in IHC analysis of p27 (C) or HP1-γ (D). Representative images (400x) are presented.
(E) Allred method determination of relative p27 levels (as Allred index) in the VPs of wt and transgenic animals at ~ 3 mo. (n=5).
(F) Western blotting analysis of p27 and HP1γ protein levels in the VPs of wt and transgenic animals. Lamin A/C was used as loading control. The relative ratios of p27:lamin and HP1-γ:lamin were shown by setting the corresponding wt values to 1.0.

