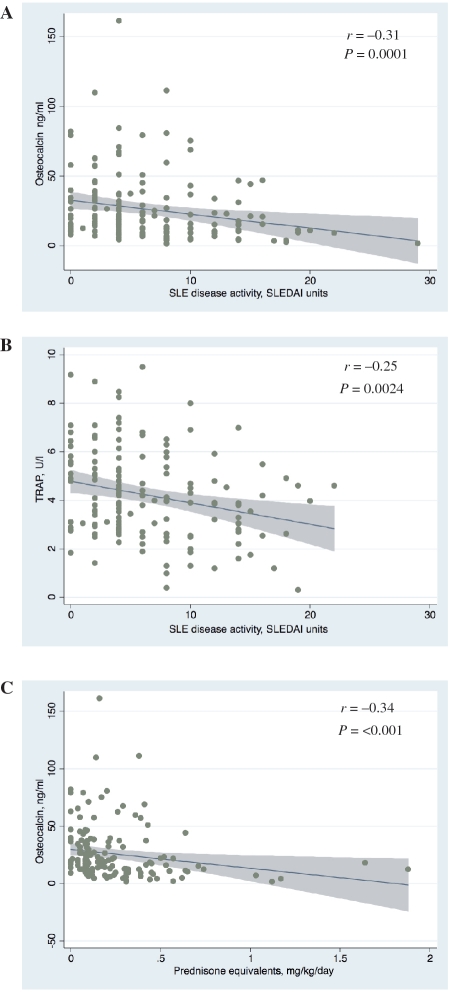
Fig. 1.
Relationship between SLE disease activity, measured as SLEDAI or CS exposure and markers of bone turnover. Scatter plots are overlaid with fitted regression lines and 95% CIs. (A) Bone formation. Serum osteocalcin vs SLEDAI (n = 157). (B) Bone resorption. Serum TRAP vs SLEDAI (n = 148). (C) Serum osteocalcin vs prednisone equivalents.

