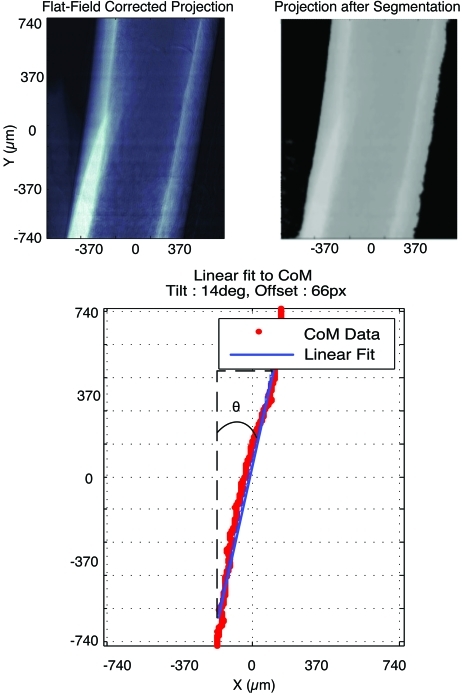
Figure 4.
An example of the image-processing steps taken to perform the alignment on a femur at 1.4 µm pixel size. Units are given in micrometers. The upper-left image is the flat-field corrected projection, with white representing higher absorbing regions. The upper-right frame is the image after segmentation is performed using a fixed threshold. There is no metal in this image so only the two phases are visible: sample (gray) and air (black). The lower frame shows the points for the line-by-line center of mass (CoM) calculation (red points) as well as the curve fit (blue line).

