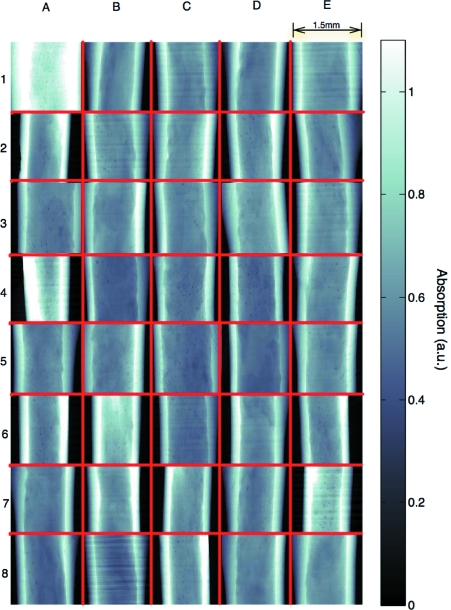
Figure 8.
Projections of 40 aligned bones. The images are organized in a 5 × 8 grid (red) and are flat-field and logarithmically corrected. Brighter intensity represents more absorption. Some of the samples are slightly larger than the field of view, but all are straight and centered within the 10 µm tolerance. Notice in images E2 and D3 that the bone appears to be slightly tilted. This is due to the anisotropic shape of the bone and in these cases the alignment of the edges provides a different result than the alignment of the center of mass based on absorption. The center of mass alignment is advantageous as it maximizes the volume of bone that is within the field of view.

