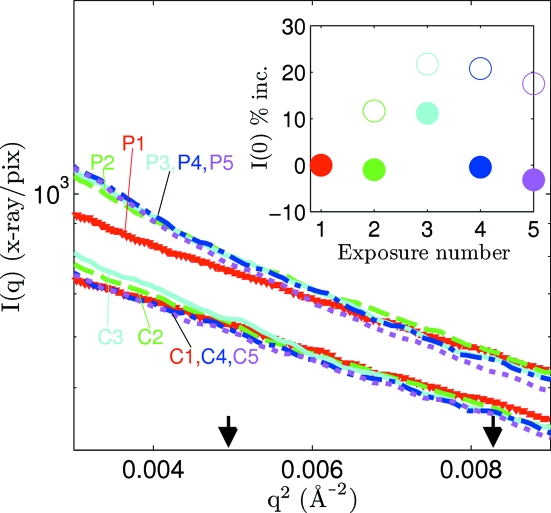
Figure 4.
Low-angle region Guinier plots for 1 s exposures that show the consequence of detector readout time and data acquisition procedures on perceived radiation damage. Acquisitions from the MMPAD are labeled P and from the CCD are labeled C and then both are followed by the exposure number. The Shannon limit (q 2 = 0.0049 Å−2) and the Guinier limit (q 2 = 0.0083 Å−2) are indicated by arrows. The inset shows the percent increase in the forward scattering from the first exposure. In the inset, CCD data are represented by filled symbols and MMPAD data by open symbols. There was 860 µs between each exposure acquired by the MMPAD. For the CCD acquisitions the time with the X-ray shutter closed between exposures was, in order, 52, 35, 89 and 91 s.

