Abstract
The Dartmouth Atlas method for examination of variation in care at the end of life was replicated by Kaiser Permanente (KP). Variation within KP was analyzed and compared with corresponding Dartmouth Atlas Hospital Referral Regions. Although KP inpatient care use rates were 25% to 30% lower and hospice use rates were higher than in the surrounding communities, there was still two- to four-fold variation in inpatient care use across KP geographic areas. Evidence suggests that more, or more intensive, care for this population is neither necessarily better nor desired by patients. If all California (CA) KP residence areas had the hospital day rate of the average of the lowest three, 2005 decedents would have had more than 50,000 fewer hospital days in their last six months of life. High-intensity care accounts for a large proportion of the overall variation in total costs for this population. This strongly reinforces the focus on appropriate intensive care unit (ICU) use in end-of-life care. Greater emphasis on palliative care approaches for patients with chronic conditions and earlier transition to the use of hospice would create a better match between the expressed desires of patients and the care they receive, thus improving member and family satisfaction as well as quality of care. In addition, earlier transition to hospice in KP could be one important tool for avoiding undesired and nonbeneficial ICU use, given the negative correlation between hospice and ICU use identified in this analysis.
Geographic variation in hospital use within KP appears to be correlated with variation in the surrounding communities, even though it is lower on average within KP than outside it. This suggests that KP resource use may be influenced at least in part by broader community practices.
Background: The Dartmouth Atlas of Health Care
Wennberg and Gittelsohn published their first study of small area variation in 1973.1 Since then, they and their colleagues at the Dartmouth Center for the Evaluative Clinical Sciences have consistently and conclusively demonstrated in the Dartmouth Atlas of Health Care2 striking unwarranted variation in health care resource use in the US, using innovative methods of measuring population-based use rates. Medicare spending in 2003, for example, after adjustment for age, sex, and race, was twice as high in Miami as in Minneapolis and 50% higher in Los Angeles as in San Francisco. Recently, Wennberg et al have developed another innovative methodology for cross-sectional comparisons, focusing on end-of-life care of Medicare patients with serious chronic illnesses to address issues of population risk comparability across different geographic regions and institutions. In evaluating variation in hospital days per decedent among the US News & World Report “best” academic medical centers,3 for example, they found variation of two- to three-fold (Figure 1). This prompted noted health economist Uwe Reinhardt to comment, “How can the best medical care in the world cost twice as much as the best medical care in the world?”4 They have also found dramatic variation within health care systems, as shown in Figure 2, also with two- to three-fold variation in hospital days per decedent among major California (CA) health care systems.5 This work provoked the current investigation within Kaiser Permanente (KP), using the Dartmouth Atlas methodology to examine internal variation and compare performance with Dartmouth Atlas benchmarks.
Figure 1.
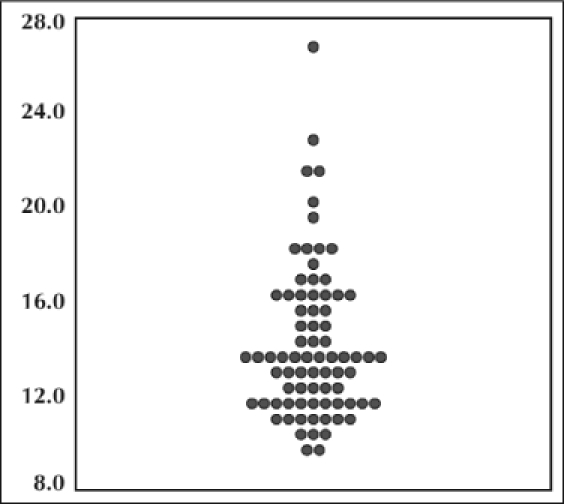
Days in hospital per decedent during last six months of life among patients assigned to the 77 “best” US hospitals (1999–2003). Adapted and reprinted with permission from the author and the British Medical Journal from: Wennberg JE, Fisher ES, Stukel TA, Skinner JS, Sharp SM, Bronner KK. Use of hospitals, physician visits, and hospice care during the last six months of life among cohorts loyal to highly respected hospitals in the United States. BMJ 2004 Mar 13;328(7440):607.
Figure 2.
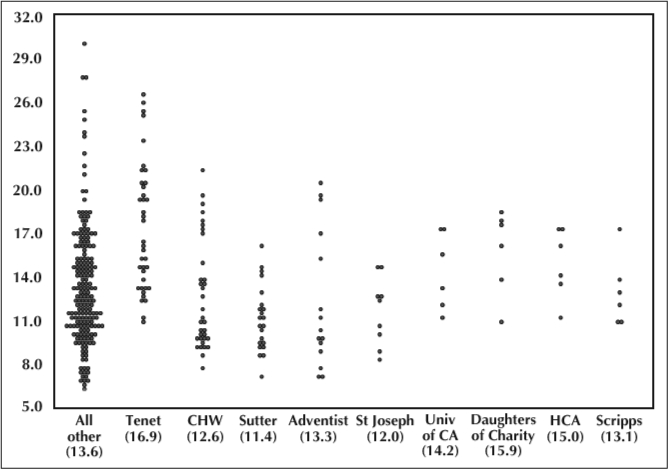
Hospital days per decedent during last six months of life among California hospitals belonging to selected systems (weighted average in parentheses) (1999–2003). Adapted and reprinted with permission from the author: Wennberg JE. Understanding Practice Patterns: A Focus on What the Quality Movement Can Do to Reduce Unwarranted Variations from his PowerPoint presentation at the Institute for Healthcare Improvement 2005 17th Annual National Forum on Quality Improvement in Health Care and availabe from: www.dartmouthatlas.org/.2
This prompted noted health economist Uwe Reinhardt to comment, “How can the best medical care in the world cost twice as much as the best medical care in the world?”4
Focusing on end-of-life care has a number of important advantages. First, it provides insight into important drivers of total costs. End-of-life care represents a substantial fraction of all health care costs. As noted above, it ensures comparability, because these patients all have the same outcome.
Also, as it turns out, the Dartmouth researchers have found that overall Medicare spending is highly correlated with spending for those at end of life.6 Second, differences across regions and providers are largely due to supply-sensitive services, where variation is driven in large part by differences in supply or availability of resources, such as hospital beds and specialists per capita.7 Such services include use of a hospital/intensive care unit (ICU) as the site of care, frequency of visits, and frequency of specialist consultations. Third, normative interpretation is possible. What do higher-spending regions (and systems) get? There is no evidence that greater use is associated with health benefits, and preferences are unlikely to explain greater use. There is evidence that the technical quality of care is worse; there is no more elective surgery; and there are more hospital stays, visits, specialist consultations, and tests than in lower-spending regions. Mortality rates are slightly higher, and functional outcomes are no better.7,8 There is worse communication among physicians, greater difficulty ensuring continuity of care, greater difficulty providing high-quality care, and an even greater perception of scarcity in higher-spending regions.9 Patients are less satisfied with their hospital care, and their access to primary care is worse.5,7 Clearly, more is not always better.
Study Design and Methods
The objectives of the KP study were to identify opportunities to improve the quality and cost of care in the last six months of life for KP members through analysis of internal variation and identification of internal and external performance benchmarks and to provide this information for ongoing efforts to identify and spread successful practices for the care of this population. Study questions included the following:
How does inpatient and hospice utilization in the last six months of life vary across KP residence areas and Regions?
What are the patterns of variation?
How does KP performance compare with Dartmouth Atlas benchmarks?
What are the opportunities associated with reduction of variation?
What are the implications for identification and spread of successful practices?
The study population consisted of Medicare members age 65.5 years and older, continuously enrolled for the six months prior to death, and who died during calendar year 2005. The analysis period was therefore July 2004 through December 2005. The minimum age of 65.5 years was selected to accommodate the six-month look-back as a Medicare member. Decedents were identified by linking KP data with data from the Social Security Administration. The geographic units were KP residence areas in CA and Regions outside of CA. In CA, the substantial majority, but not all, of member use occurs in their residence area. Measures of care in the last six months of life included total hospital days, ICU days, and hospice utilization. For selected measures, Medicare Hierarchical Condition Category (HCC) risk scores, as used for Medicare reimbursement, were used to calculate actual to expected ratios in CA.
Because of data limitations, there were some differences from the Dartmouth Atlas in the population identification and measurement specifications. The Dartmouth Atlas includes traditional Medicare fee-for-service patients only, whereas KP members primarily participate in capitated Medicare Advantage. We included all Medicare members regardless of payment mechanism. The Dartmouth Atlas includes only those decedents with one or more of 12 major chronic conditions defined by Iezzoni et al,10 whereas the KP study included all decedents. However, those 12 major chronic conditions account for the vast majority of Medicare deaths.11 In CA, ICU days in non-KP facilities were not separately identified, and therefore outlying areas with high percentages of non-KP hospital use had to be excluded. In addition to chronic condition status, the Dartmouth Atlas data were further risk-adjusted for age, sex, and race. The KP data were not risk-adjusted beyond decedent status. However, as noted above, Medicare HCC scores were used to calculate actual-to-expected ratios for certain measures. Finally, the Dartmouth Atlas study period was 2000–2003, compared with 2005 for KP.
Results
Variation within Kaiser Permanente
Medicare decedents were slightly younger in Southern CA than in Northern CA and regions outside CA. In Southern CA, 31% were age 85 years and older compared with 35% in Northern CA and 37% in Regions outside CA (Table 1). Death rates were calculated as a percentage of deaths among the total Medicare membership. The rates were similar in Northern CA (3.8%) and Southern CA (3.4%) but lower in regions outside CA (2.3%). This is most likely because of the more inclusive algorithm used in CA to link KP and Social Security data sets that include deaths.
Table 1.
Hospital and ICU days per decedent, and hospice enrollment in KP CA residence areas and regions outside CA, and corresponding Dartmouth AtlasHospital Referral Regions
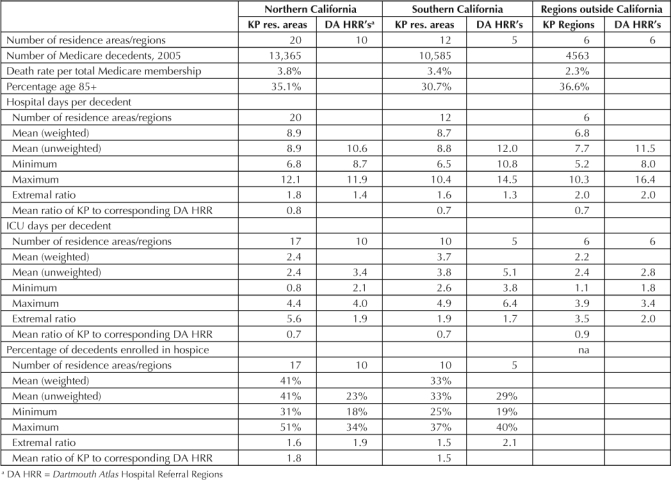
There was over two-fold variation in hospital day rates across KP (Figure 3). The Northern CA average was 8.9 days in the last 6 months of life, ranging from 6.8 to 12.1 days across 20 residence areas. The Southern CA average was 8.7 days, ranging from 6.5 to 10.4 days across 12 residence areas. The average for the regions outside of CA was 6.8 days, ranging from 5.2 to 10.3 days across 6 regions. To test the impact of relative population risk on the variation in hospital day rates, actual-to-expected ratios were calculated for the CA residence areas, using average Medicare HCC scores in a residence area to calculate expected rates (actual rate divided by HCC score). The HCC scores are risk-adjustment factors used to adjust Medicare reimbursement, adjusting for demographic and diagnostic differences across populations.12 This risk adjustment did not have a significant impact on the rank order of observed results across residence areas. The rank-order correlation with raw hospital day rates was .82, suggesting that differences in relative risk across residence areas was not a major factor in explaining the variation.
Figure 3.
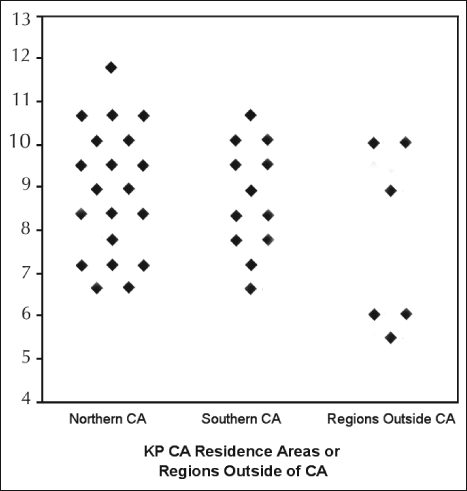
Variation in hospital days per decedent in last six months of life, KP CA Residence areas and regions outside of CA, 2005
There was four-fold variation in ICU day rates across KP. The Northern CA average was 2.4 days in the last 6 months of life, ranging from 0.8 to 4.4 days across 17 residence areas. The Southern CA average was 3.7 days, ranging from 2.6 to 4.9 days across 10 residence areas. The average for regions outside CA was 2.2 days, ranging from 1.1 to 3.9 days across 6 regions.
There was twofold variation across CA residence areas in the percentage enrolled in hospice. The Northern CA average was 41%, ranging from 31% to 51% across 17 residence areas. The Southern CA average was 33%, ranging from 25% to 37% across 10 residence areas.
A correlation analysis among the KP measures was performed. Of note, the percentage enrolled in hospice was negatively correlated with ICU days (r = −.40).
Comparison to Dartmouth Atlas Benchmarks
The Dartmouth Atlas includes 306 Hospital Referral Regions (HRRs) in the US. They are defined by hospital referral patterns, and represent regional health care markets for tertiary medical care.2 KP residence areas and Regions were mapped to these HRRs. The 20 residence areas in KP's Northern CA Region were mapped to 10 Dartmouth Atlas HRRs; the 12 residence areas in KP's Southern CA Region were mapped to 5 Dartmouth Atlas HRRs; and the 6 Regions outside of CA were each mapped to a single Dartmouth Atlas HRR.
Figure 4.
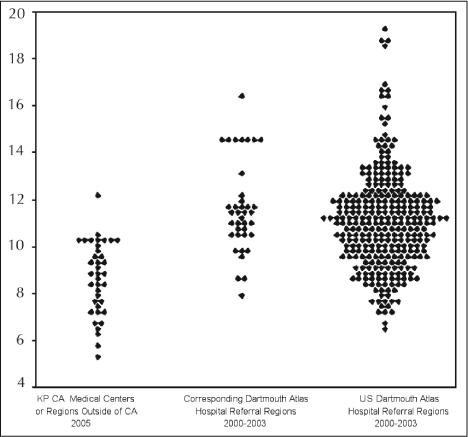
Variation in hospital days per decedent in last six months of life KP vs Dartmouth Atlas Hospital Referral Regions.
KP's inpatient use rates during the last six months of life were lower than in their surrounding communities. On average, KP's hospital day rate was 25% lower and the ICU day rate was 30% lower than in the corresponding Dartmouth Atlas HRRs. However, KP's hospice percentages were higher than in their surrounding communities, on average 73% higher than in the corresponding Dartmouth Atlas HRRs. Although there were differences in the absolute level of use between KP and the surrounding communities, KP's hospital day rate (r = .39) and ICU day rate (r = .63) were positively correlated with the rates in the corresponding Dartmouth Atlas HRRs (correlations significant at .05 level). After combining those KP residence areas where there were multiple residence areas in a single Dartmouth Atlas HRR, we found that the correlation in hospital day rates was even higher (r = .61, r2 = .37; Figure 5). However, there was no correlation in hospice percentage between KP and the corresponding Dartmouth Atlas HRRs.
Figure 5.
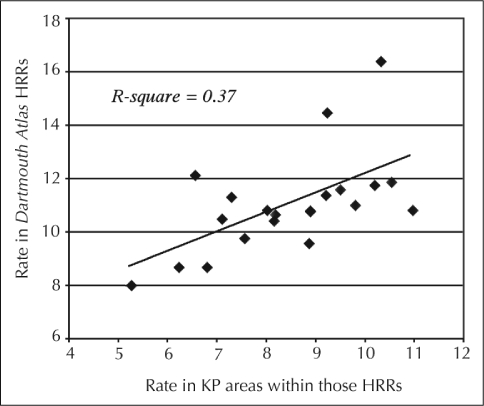
Correlation between KP and fee-for-service practice patterns: hospital days during last six months of life—Dartmouth Atlas vs KP.
This strongly reinforces the focus on appropriate ICU use in end-of-life care, especially given evidence suggesting that people prefer not to die in an ICU.13
Discussion
There is substantial variation in inpatient use in the last six months of life across KP, and corresponding opportunity for improvement. For example, if all CA residence areas had the hospital day rate of the average of the lowest three, 2005 decedents would have had more than 50,000 fewer hospital days in their last six months of life. In addition, high-intensity care in the ICU accounts for a large proportion of the overall variation in total costs for this population across KP geographic areas, consistent with general findings in the Dartmouth Atlas.6 This strongly reinforces the focus on appropriate ICU use in end-of-life care, especially given evidence suggesting that people prefer not to die in an ICU.13 The finding of greater use of hospice in KP than in the surrounding communities is consistent with previously published findings of higher hospice use in managed care compared to fee-for-service patients dying with cancer.14 Even greater use of hospice in KP, even though it appears to be higher than in the broader community, could be one important option that avoids unwanted and nonbeneficial ICU use, given the negative correlation identified in this analysis.
Geographic variation in hospital use within KP appears to be correlated with variation in the surrounding communities, even though it is lower on average. This suggests that KP resource use may be influenced at least in part by broader community practices. Further investigation is warranted.
Some important limitations and caveats that could influence these findings must be noted:
The Dartmouth Atlas includes only those with major chronic conditions and excludes people with no health care use in last two years of life. This could cause the Dartmouth Atlas resource use to look higher.
The Dartmouth Atlas data are also risk-adjusted for age, sex, race, and chronic conditions.
The KP data did not include ICU use in non-KP hospitals in CA. This could have a significant effect even in residence areas with KP facilities, by not including direct emergency admissions and transfers to outside facilities. Information on non-KP hospital use will be included in subsequent analyses.
Fewer deaths are identified in the Regions outside of CA compared with CA. Work is underway to improve the algorithm for matching KP and Social Security records.
In both KP and the Dartmouth Atlas, residence area use does not correspond directly to use of facilities within that residence area, because some patients use facilities outside their residence area and some who reside outside the residence area use facilities in the area. Therefore, comparisons across facilities are not directly supported with this information. It is possible to replicate the study with medical centers as the unit of analysis, but the need for appropriate risk adjustment is greater.
A national palliative care dashboard, including selected Dartmouth Atlas measures, is under development in KP, which will enable ongoing benchmarking and analysis of variation in these measures. In addition, this analysis suggests some potentially valuable areas for further analysis, including investigation of
The influence of community practice on KP geographic variation and the factors that account for that influence
The relationship between measures of resource intensity and quality of care
The differences in costs across KP Regions and medical centers
The relationship between bed and provider supply in a geographic area within KP and resource use
The relationship between structural and process attributes and efficiency of resource use
The relationship between end-of-life care and overall care by medical center and Region.


Acknowledgments
We gratefully acknowledge the contributions of Joseph Severson, of Decision Support Systems for the Regions outside of CA, and Amy Barbarasch, Marcus Lee and Jeffrey Bennett of Management Information and Analysis for CA, and their colleagues, for their contributions to this study.
Katharine O'Moore-Klopf of KOK Edit provided editorial assistance.
References
- Wennberg J, Gittelsohn A. Small area variations in health care delivery: a population-based health information system can guide planning and regulatory decision-making. Science. 1973 Dec 14;182:1102–8. doi: 10.1126/science.182.4117.1102. [DOI] [PubMed] [Google Scholar]
- The Dartmouth Atlas of Health Care [Web page on the Internet] Lebanon (NH): The Dartmouth Institute for Health Policy and Clinical Practice; [cited 2007 Oct 2]. Available from: www.dartmouthatlas.org/ [Google Scholar]
- America's best hospitals. US News and World Report. 2001;131(3) [Google Scholar]
- Kolata G.Sharp regional incongruity found in medical costs and treatments [serial on the Internet] New York: The New York Times on the Web Special Edition; 1996 Jan 30. [cited 2007 Oct 2]: [about 4 pages]. Available from: www.nytimes.com/specials/women/warchive/960130_1576.html. [Google Scholar]
- Wennberg JE, Fisher ES, Baker L, Sharp SM, Bronner KK. Evaluating the efficiency of California providers in caring for patients with chronic illness. Health Aff (Millwood) 2005 Jul–Dec:W5-526–43. doi: 10.1377/hlthaff.w5.526. Suppl Web Exclusives. [DOI] [PubMed] [Google Scholar]
- Wennberg JE, Fisher ES, Sharp SM, McAndrew M, Bronner KK, Dartmouth Atlas of Health Care 2006 The care of patients with severe chronic illness: an online report on the Medicare program: Figures 5.2, 5.3 [monograph on the Internet] Lebanon (NH): The Center for the Evaluative Clinical Sciences; 2006. [cited 2007 Oct 8]. Available from: www.dartmouthatlas.org/atlases/2006_Chronic_Care_Atlas.pdf. [Google Scholar]
- Fisher ES, Wennberg DE, Stukel TA, et al. The implications of regional variations in Medicare spending. Part 1: the content, quality, and accessibility of care. Ann Intern Med. 2003 Feb 18;138(4):273–87. doi: 10.7326/0003-4819-138-4-200302180-00006. [DOI] [PubMed] [Google Scholar]
- Fisher ES, Wennberg DE, Stukel TA, Gottlieb DJ. Variations in the longitudinal efficiency of academic medical centers. Health Aff (Millwood) 2004:VAR19–32. doi: 10.1377/hlthaff.var.19. Suppl Web Exclusives. [DOI] [PubMed] [Google Scholar]
- Sirovich BE, Gottlieb DJ, Welch HG, Fisher ES. Regional variations in health care intensity and physician perceptions of quality of care. Ann Intern Med. 2006 May 2;144(9):641–9. doi: 10.7326/0003-4819-144-9-200605020-00007. [DOI] [PubMed] [Google Scholar]
- Iezzoni LI, Heeren T, Foley SM, Daley J, Hughes J, Coffman GA. Chronic conditions and risk of in-hospital death. Health Serv Res. 1994;29:435–60. [PMC free article] [PubMed] [Google Scholar]
- Hogan C, Lunney J, Gabel J, Lynn J. Medicare beneficiaries' costs of care in the last year of life. Health Aff (Millwood) 2001 Jul–Aug;20(4):188–95. doi: 10.1377/hlthaff.20.4.188. [DOI] [PubMed] [Google Scholar]
- Pope GC, Kautter J, Ellis RP, et al. Risk adjustment of Medicare capitation payments using the CMS-HCC model. Health Care Financ Rev. 2004 Summer;25(4):119–41. [PMC free article] [PubMed] [Google Scholar]
- A controlled trial to improve care for seriously ill hospitalized patients. The study to understand prognoses and preferences for outcomes and risks of treatments (SUPPORT). The SUPPORT Principal Investigators. JAMA. 1995 Nov 22–29;274(20):1591–8. Erratum in: JAMA 1996 Apr 24;275(16):1232. [PubMed] [Google Scholar]
- McCarthy EP, Burns RB, Ngo-Metzger Q, David RB, Phillips RS. Hospice use among managed care and fee-for-service patients dying with cancer. JAMA. 2003 May;289(17):2238–45. doi: 10.1001/jama.289.17.2238. [DOI] [PubMed] [Google Scholar]


