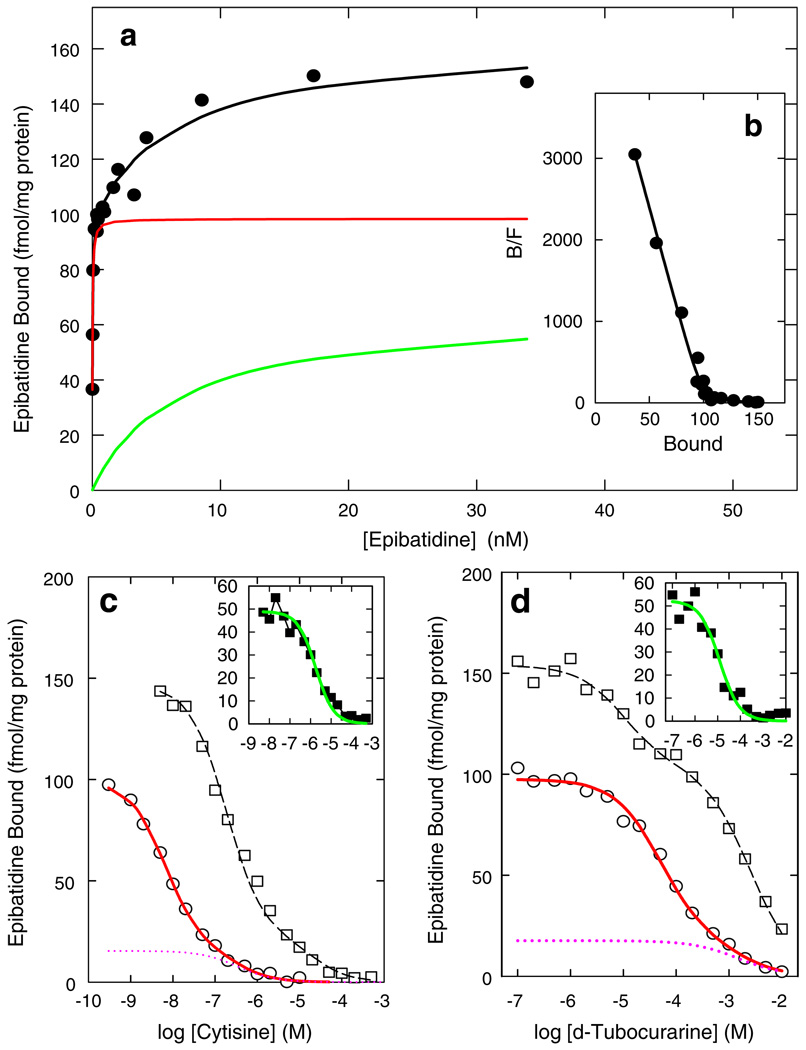
Figure 1.
[3H]Epibatidine binding to whole mouse brain membranes. The saturation curve for [3H]epibatidine binding is shown in a. The black circles represent the data points. Total binding, represented by the black curve, was resolved into high-affinity (red) and low-affinity (green) components. b displays the Scatchard plot for the data in a. Inhibition of [3H] epibatidine binding (0.4 nM, open circles; 12.5 nM open squares) by cytisine is shown in c. The solid red curve displays the biphasic fit for inhibition using 0.4 nM [3H]epibatidine and the dotted red line illustrates the estimated cytisine-resistant component of this binding. The inset to c shows the inhibition of the lower-affinity [3H]epibatidine binding sites. Inhibition of [3H]epibatidine binding (0.4 nM, open circles; 12.5 nM open squares) by d-tubocurarine is shown in d. The solid red curve displays the biphasic fit for inhibition using 0.4 nM [3H] epibatidine and the dotted red line illustrates the estimated d-tubocurarine-resistant component of this binding. The inset to d shows the inhibition of the lower-affinity [3H]epibatidine binding sites. This figure was modified from Marks et al. (1999)

