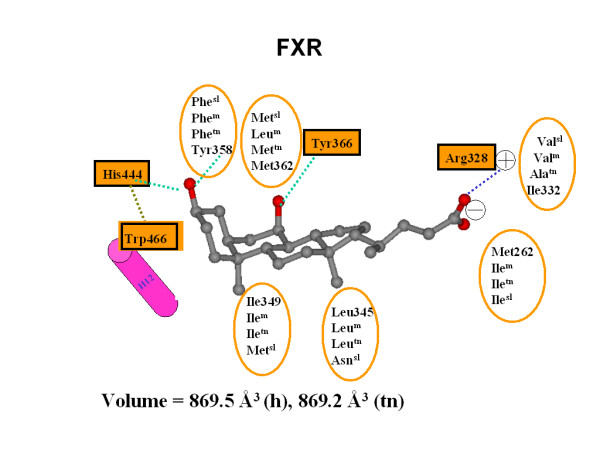
Figure 10.

FXR-ligand interactions. Interaction map between the primary bile acid chenodeoxycholic acid and FXRs. Key residues involved in binding are listed for human, mouse (m), Tetraodon (tn), and sea lamprey (sl) FXRs (the residue number is for human). Conserved resides throughout the four species are highlighted by black boxes. Hydrogen bonds are shown by green dashed lines, the electrostatic charge interaction is presented as a blue dashed line, and the important cation-π interaction for FXR is depicted as a brown dashed line. The ligand is shown as ball and stick presentation and colored according to atom types (gray = carbon, red-oxygen).
