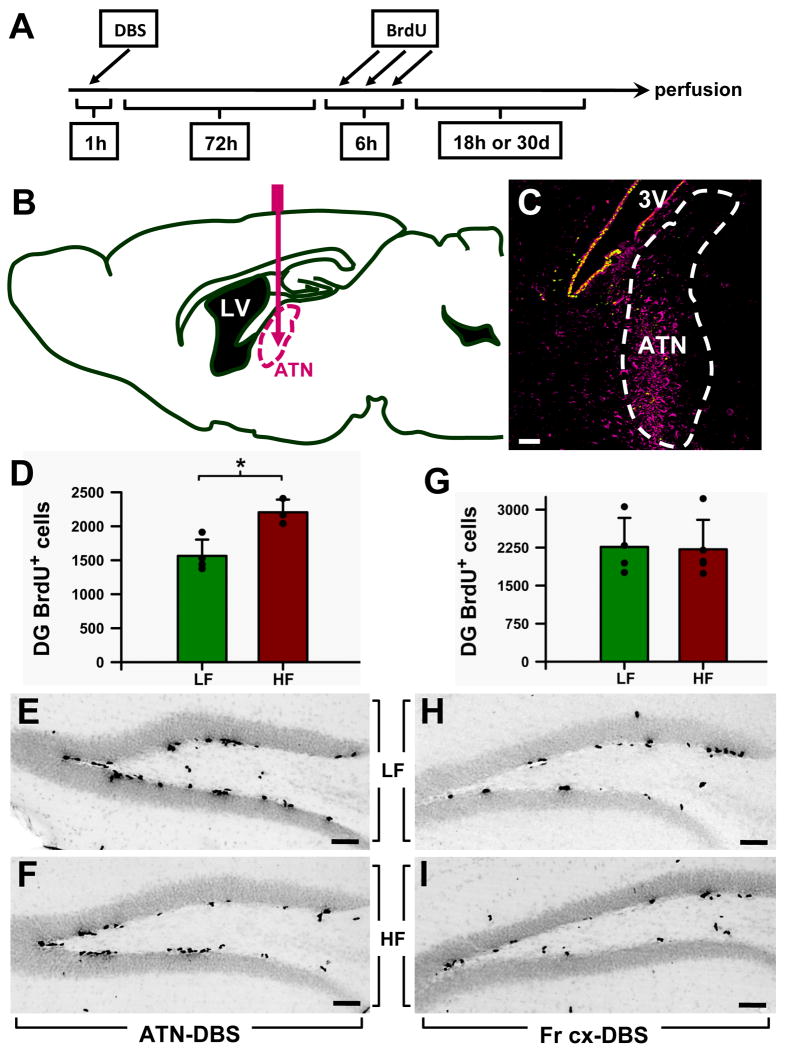
Figure 1. Specificity of the ATN stimulation in increasing cell proliferation in the adult mouse DG.
A: Scheme of the protocol detailed in the Material and Methods section.
B: Scheme of the pathway followed by the electrode to reach the anterior thalamic nuclei (ATN) in the mouse brain.
C: Glial activation (identified by vimentin immunostaining) was used for post mortem confirmation that the electrode was inserted into the correct area. The image is from a sagittal slice of the brain after applying stimulation. Vimentin immunostaining is seen as a magenta signal and the Nestin-CFPnuc signal as green. 3V: third ventricle.
D: Stimulation applied to the ATN increases cell proliferation in the DG of adult wild-type mice. In the control LF (low frequency) group, the electrode was inserted in the ATN and the electrical current was applied at 10 Hz; in the experimental group (the HF group), the current was applied at 130Hz. The stereological quantification of the BrdU+ cells showed significantly increased cell proliferation (by 40%, p=0.0125) in the DG of the HF group.
E,F: Representative images of the DG from an LF (E) and a HF (F) mouse after immunostaining for BrdU.
G: To test the specificity of the ATN stimulation in increasing DG cell proliferation, in a separate group of animals the frontal associative area of the cortex (FrA) was targeted. Quantification of the BrdU+ cells in the DG showed that there was no difference in cell proliferation between the LF and the HF groups.
H,I: Representative pictures of the DG of LF (H) and HF (I) mice after BrdU immunostaining. Data are shown as mean±s.e.m (n=4 mice for all groups, represented by black dots here and in other figures). *p<0.05. Scale bar is 50μm in all pictures.

