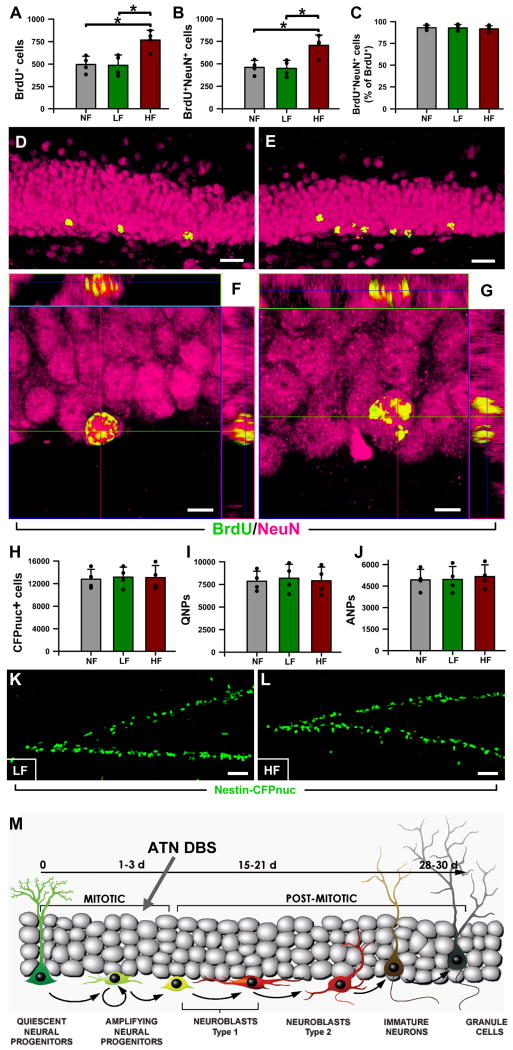
Figure 6. High frequency stimulation of the ATN increases neurogenesis in the adult mouse DG.
A: The number of BrdU+ cells, measured 1 month after BrdU administration, was significantly increased in the DG of the HF mice.
B: The number of newly-generated neurons (BrdU+NeuN+cells) was increased as well.
C: The proportion of neurons (NeuN+BrdU+) within the population of new-born cells (BrdU+ cells) was not affected by the stimulation of the ATN.
D,E: Representative confocal microscopy images of the DG from LF (D), and HF (E) animals. The BrdU+ cells are located in the lower section of the granule cell layer and are found in higher number in the HF animals (E).
F,G: Orthogonal projections, at high magnification, of NeuN+BrdU+ cells from LF (F) and HF (G) mice, showing their neuronal fate of new-born cells. Data are shown as mean±s.e.m. (n=4 mice in all groups) *p<0.05. Scale bar is 20μm in (D,E) and 5μm in (F, G).
H-J: The total number of neuroprogenitors (Nestin-CFPnuc+ cells) is similar for all the animal groups one month after the BrdU administration (H). The same is true for the number of QNPs (I) and ANPs (J).
K,L: Representative images of the DG from the LF (K) and HF (L) animals after immunostaining for CFP. No differences were found in terms of numbers, location, or morphology of the DG neuroprogenitors. Data are show as mean±s.e.m. (n=4 mice in all groups). *p<0.05. Scale bar is 20μm in (D,E), 5μm in (F,G), and 50μm in (K,L).
M. Schematics of the differentiation cascade in the DG and progenitor population targeted by DBS of the ATN. Basic scheme of neurogenesis corresponds to that in (Encinas et al., 2006).

