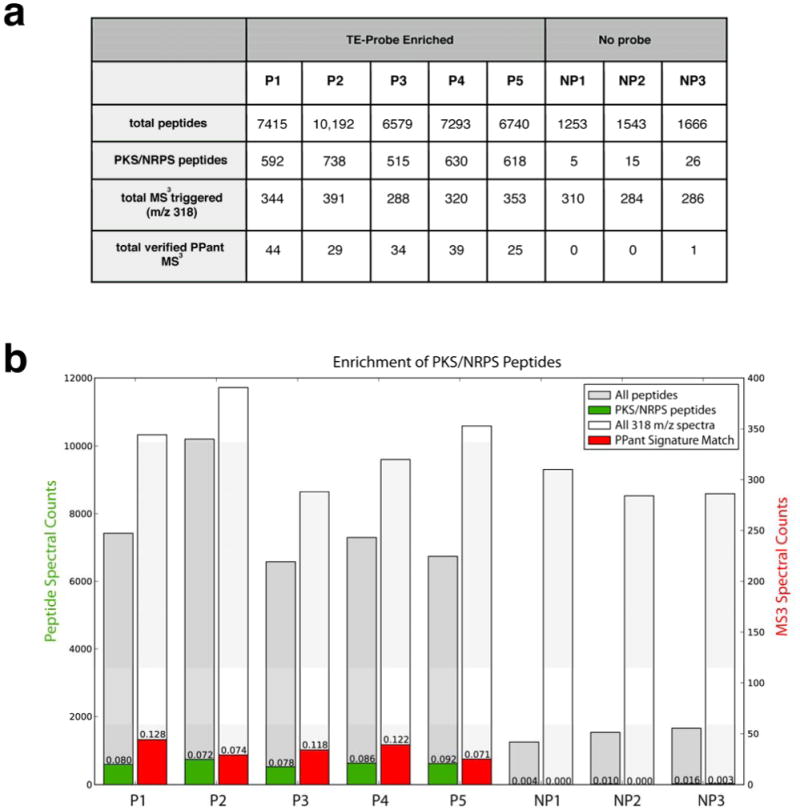
Figure 3.

PPant peptide enrichment statistics. (a) Table denoting total number of peptides identified by database search of individual replicates of enriched (probe-treated, P) and non-enriched (no probe, NP) B. subtilis proteome, as analyzed by MudPIT. PKS/NRPS peptides refer to peptides whose protein products are encoded by the srf, dhb, pps, or pks gene clusters in B. subtilis. PPant signature match refers to how many 318 m/z MS3 spectrum from each MudPIT dataset contain 4 out of the 6 most significant pantetheinyl ions as annotated by Meluzzi et al. (b) Same data presented in graphical form.
