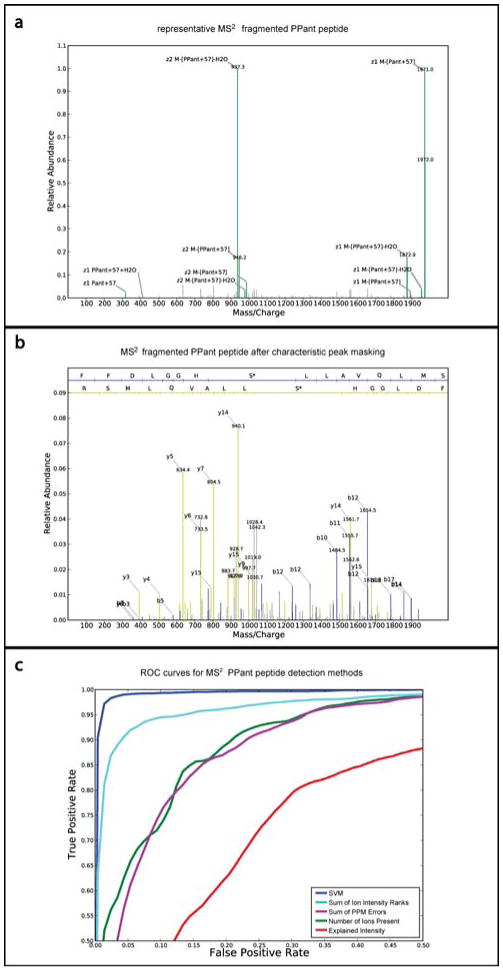
Figure 4.

Ejection species dominate the MS2 spectrum of a PPant peptide. (a) MS2 spectrum (scan 13673, run fp3-04) of +2 charged peptide “FFDLGGHS*LLAVQLMSR” from DhbF protein (asterisk denotes site of PPant modification). The parent peptide (M), neutral and charged ejection parent peptides, and 318 m/z alkylated pantetheine (Pant+57) account for a majority of the spectrum's ion intensity (Table S2). The relative abundance is scaled such that the max intensity peak is 1.0. (b) Same spectrum after removal of characteristic PPant species. The b and y ions associated with each peptide bond cleavage are more visible permitting improved peptide identification. Relative abundance is depicted on the same scale as in “a”. (c) Receiver Operating Characteristic (ROC) curves of true positive and false positive rates of SVM approach for detecting PPant spectra from MS2 data. SVM detection is compared to detection of PPant peptides based on Sum of Intensity Rank of Ions, Sum of PPM Error, Number of Ions Present, and Explained Intensity of annotated PPant ions. The curves show average test performance from 30 rounds of 5-fold cross validation for each method.
