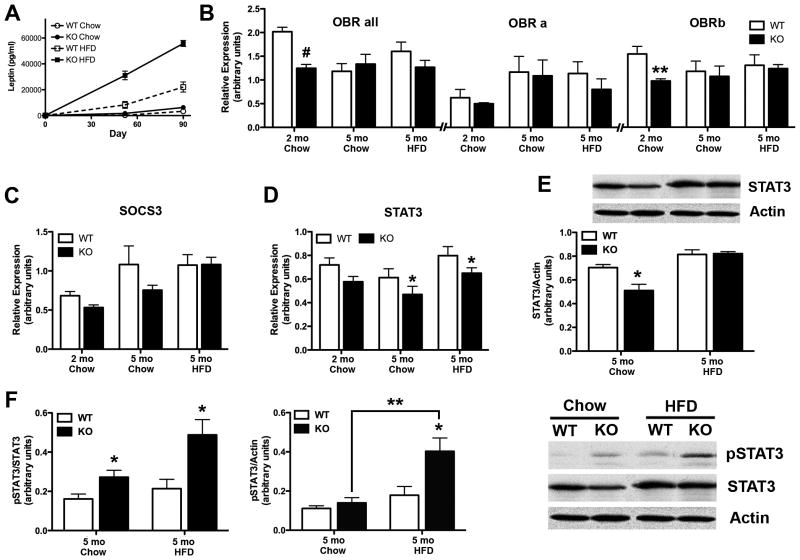
Fig. 4.
TIMP-2 KO mice exhibit leptin-signalling deficiencies. (A) EIA of serum leptin revealed comparable leptin levels in weight-matched male WT and TIMP-2 KO mice at the study start (WT = 86.97 ± 33.47 pg/ml, KO = 131.1 ± 35.28 pg/ml, p = 0.39). While leptin levels increased greater in TIMP-2 KO mice than WT mice throughout the study, this increase was proportional to their body weight (R2 = 0.85). n = 6 per genotype and diet. (B-D) qPCR was used to analyze mRNA expression of components of the leptin signalling cascade in male hypothalami. n = 4 – 5 per genotype and diet. (E) Western blot analysis confirmed PCR findings of decreased STAT3 mRNA expression in chow-fed TIMP-2 KO mice. (F) Basal STAT3 activation was examined at the study termination. Since total STAT3 expression was decreased in chow-fed mice (E), pSTAT3 expression was normalized both to total STAT3 (left graph) and to actin (right graph). HFD increased STAT3 activation in TIMP-2 KO mice to a greater extent than in WT mice. n = 6 - 7 per genotype and diet. Data are mean ± SEM. *p < 0.05, **p ≤ 0.01, #p≤0.001 relative to WT mice on the same diet, unless otherwise indicated.

