Figure 12.

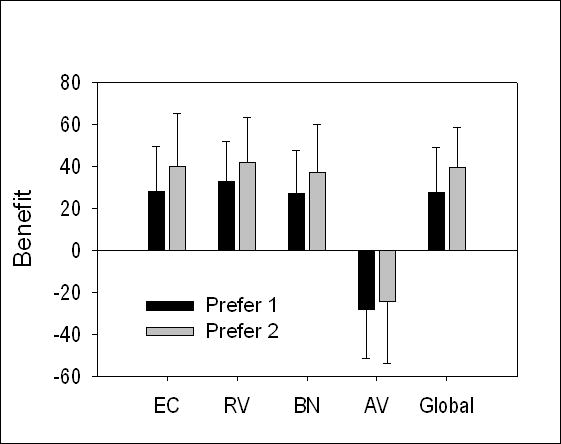
Mean benefit on the APHAB for each hearing aid preference group for each subscale (Ease of Communication, Reverberation, Background Noise, and Aversiveness to Sounds) and the Global score. Bars show one standard deviation.

Mean benefit on the APHAB for each hearing aid preference group for each subscale (Ease of Communication, Reverberation, Background Noise, and Aversiveness to Sounds) and the Global score. Bars show one standard deviation.