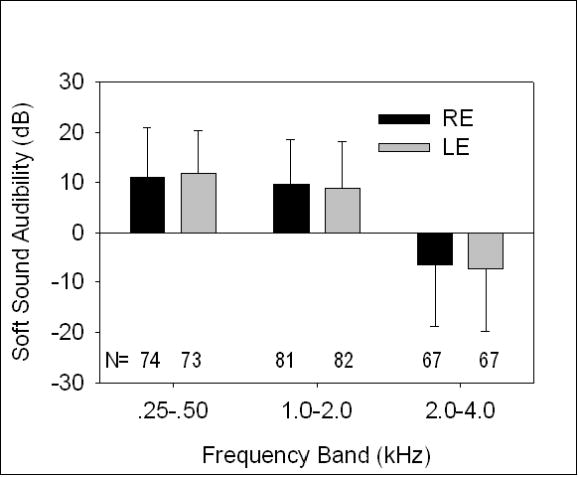
Figure 4.

Audibility of soft sounds assessed by computing the difference between pure tone thresholds (similar to 1/3 octave band levels) and the measured REAR for 45 dB speech (in approximate 1/3 octave band levels). Results are given in each ear for low-, mid-, and high-frequency bands. Bars show one standard deviation. N= number of subjects.
