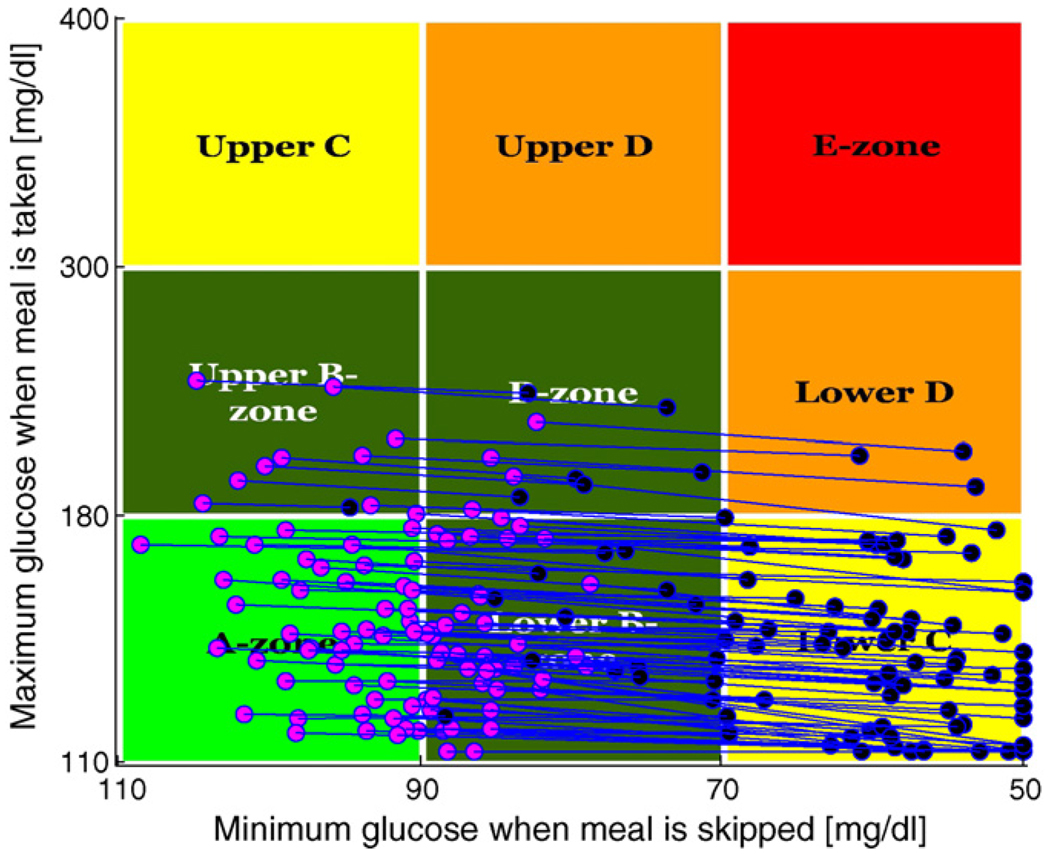
Fig. 3.
CVGA results for 100 adults comparing p(skip) = .0001 (blue) to p(skip) = .5 (pink); for p(skip) = .0001: (B) 22%, (C) 74% and (D) 4%; for p(skip) = .5: (A) 46% and (B) 54%. (For interpretation of the references to color in this figure legend, the reader is referred to the web version of the article.)

