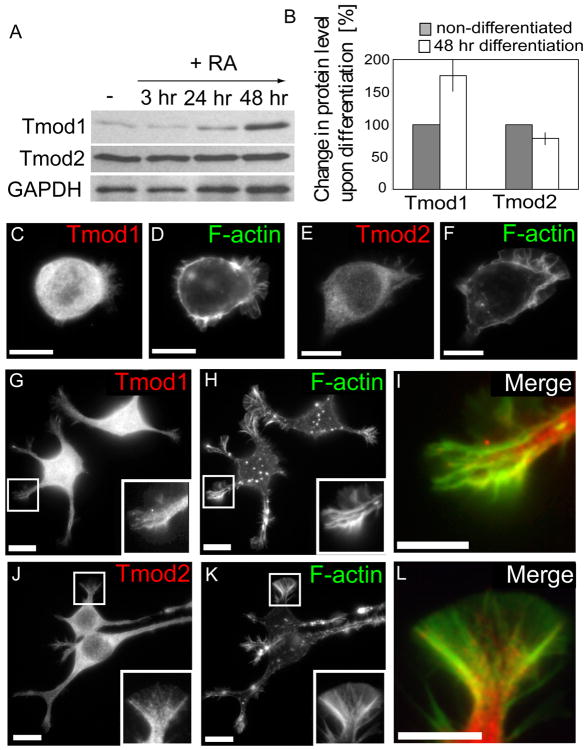
Fig. 4. Tmod levels and localization in neuroblastoma (N2a) cells before and after retinoic acid-induced differentiation.
N2a cells were plated on Poly-L-Lysine coated culture dishes (A, B) or coverslips (C-L) and induced to differentiate by addition of retinoic acid (RA) for 3 hours after plating (A, G-L). Tmod protein expression in undifferentiated cells and at different stages of differentiation was detected by western blotting for Tmod1 and Tmod2 (A). Quantification of Tmod levels with respect to GAPDH after 2 days of differentiation as compared to non-differentiated cells (B). Undifferentiated (C-F) or differentiated (G-K) cells were fixed and stained for Tmod1 (C, G), Tmod2 (E, J) and F-actin (D, F, H, K). Tmod and F-actin stains of selected regions of differentiated N2a cells were merged and displayed (I and L). Scale Bar = 20 μm (C-H and J, K) or 10 μm (I and L).

