
Fig. 5. Changes in Tmod protein levels after knockdown or over-expression of Tmod1 or Tmod2 in N2a cells.
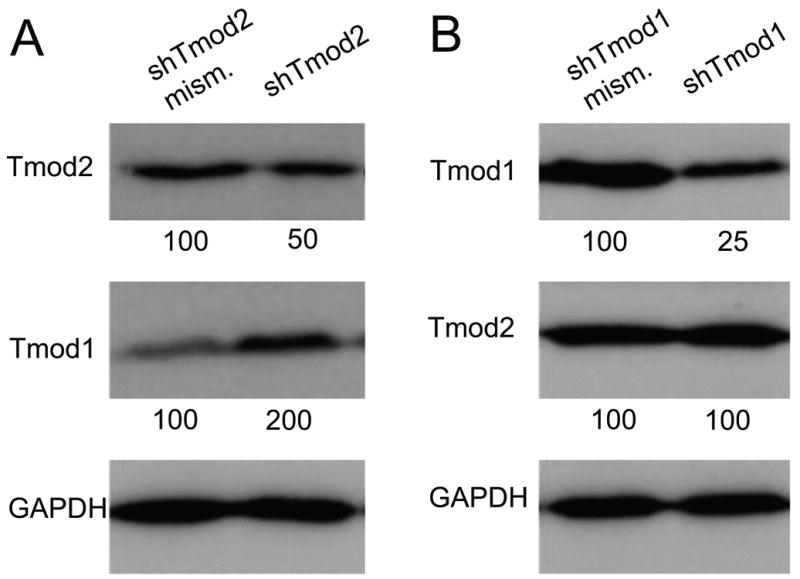
Western blots of N2a cells transfected with vectors expressing Tmod2-shRNA (A) or Tmod1-shRNA constructs (B), probed with antibodies as indicated. Mismatch shRNAs for each were used as controls for knockdown specificity. Tmod2 or Tmod1 levels were reduced at two days after transfection with the matching shRNAs to about 50% or 20%, respectively, of controls with shRNA mismatch vectors, with further decreases at day three after transfection (data not shown). Knockdown of endogenous Tmod2 leads to about a 2-fold increase in Tmod1 levels (A), while knockdown of endogenous Tmod1 has no effect on Tmod2 (B). Numbers under blots indicate relative Tmod levels, normalized to GAPDH, in this experiment.