
Figure 1.
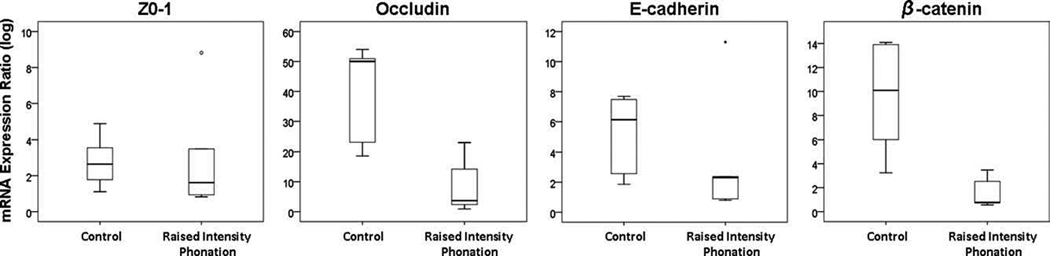
Log-transformed messenger RNA expression ratios showing significantly decreased expression of occludin and β-catenin, following a 30 minute time-dose of raised intensity phonation, compared to control. The error bars represent standard deviations from the mean. Outlier indicated by (°) and (*).