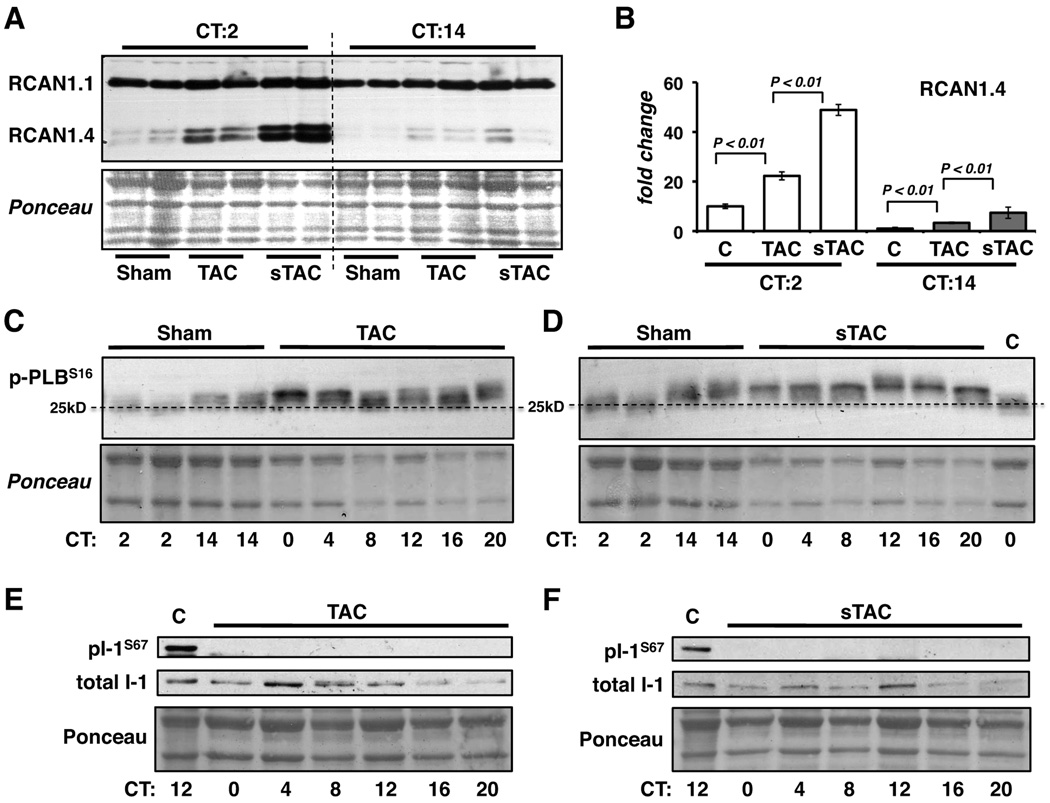
Figure 7.
Ventricular extracts isolated at CT2 and CT14 from sham operated control (c), TAB or sTAB mice were analyzed by western blot for RCAN1 protein (A). Ponceau stain of the corresponding region of the membrane is provided as a loading control. RCAN1.4 protein levels from 4–5 hearts per time point were quantified (B). Phospho-PLBSer16 (p-PLBS16) levels were compared in Sham, TAC (C) and sTAC (D) hearts at the time points indicated. The final lane in D contains extract from an unoperated control wild type mouse. Three times the amount of protein was loaded on the Sham lanes in C and D to facilitate obtaining a clear signal in the Sham lanes. The horizontal dashed line is drawn at mid-level migration of the Sham CT2 pentamer. Phospho-I-1Ser67 (pI-1S67) levels were compared in control Sham (c), TAC (E) and sTAC (F) hearts at the time points indicated. (Each lane in C, D, E and F contains samples from one heart selected randomly from an experiment with a sample size of n=3 per time point, per condition. PLB phosphorylation was elevated and I-1 phosphorylation was absent in all TAC and sTAC samples.)

