
Figure 4.
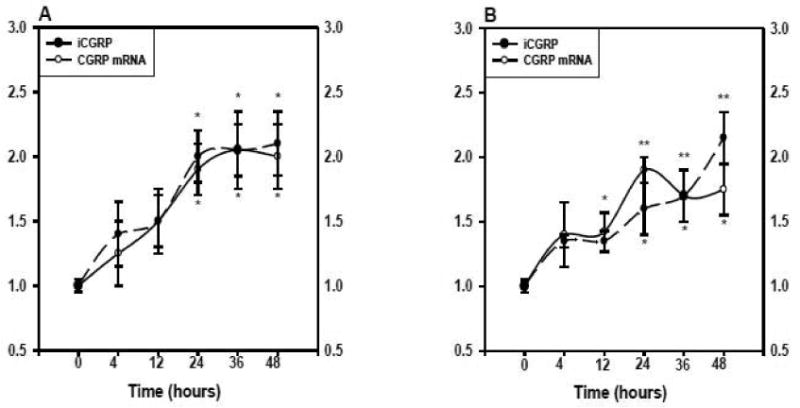
Time-dependent expression of CGRP in response to BK (panel A) or PGE1 (panel B). Cultured DRG neurons were treated for the indicated times (n=3 in triplicate/time point) with either BK (1 μM) or PGE1 (1 μM). The kininase inhibitor (1 μM) was added with the BK. Control cells for each time point were treated with vehicle only. The CGRP mRNA to 18S rRNA ratios and iCGRP levels in the medium were determined as described previously and are expressed as fold-induction over controls. The circles and solid line represent CGRP mRNA content, whereas the triangles and dashed line represent iCGRP levels. * p < 0.05, indicated time point vs control; ** p < 0.01, indicated time point vs control.