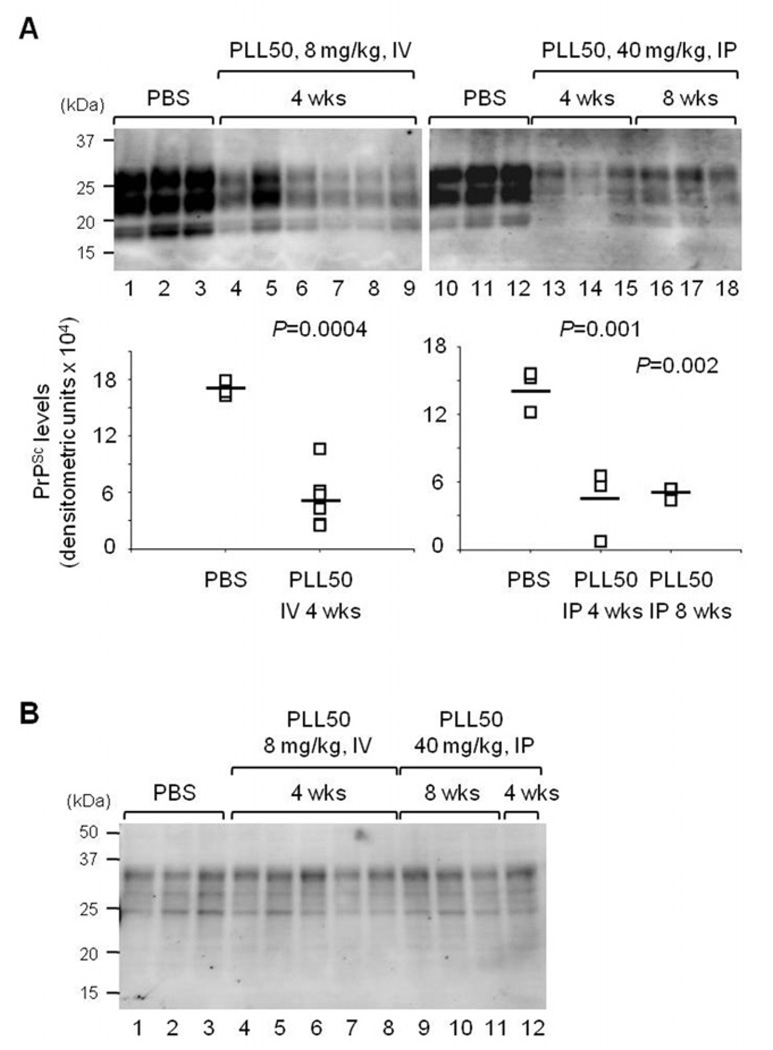
Figure 7.
The PrPC and PrPSc levels in the brains of PLL50-treated mice. A. The level of PrPSc accumulated in the brains of mice treated with PLL50. Individual mouse brains from spate groups: the PBS-treated control group (Lanes 1–3 and 10–12, n=3 each); the group received IV 8 mg/kg weekly for 4 wks (lanes 4–9, n=6); the group received IP 40 mg/kg three times a week for 4 wks (lane 13–15, n=3); and the group received IP 40 mg/kg three times a week for 8 wks (lanes 16–18, n=3). The PrPSc levels of individual brains were plotted with the averages (bars). The P-values were obtained by the statistical analysis using ANOVA. B. The levels of PrPC in the brains of mice treated with PLL50. Individual mouse brains from the PBS-treated control group (lanes 1–3); the group received IV 8 mg/kg weekly for 4 wks (lanes 4–8); and the group received IP 40 mg/kg three times a week for 8 wks (lane 9–11) and 4 wks (lane 12).

