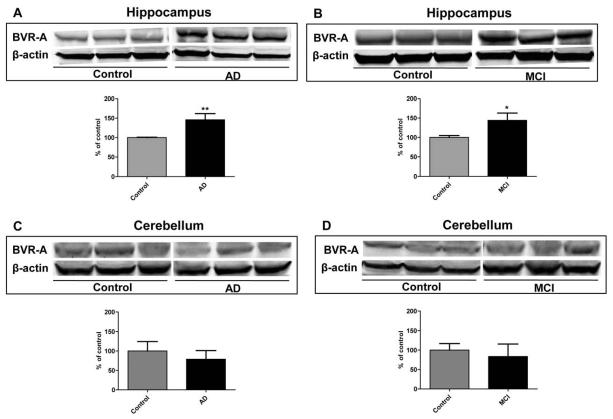
Figure 1.
Biliverdin reductase-A (BVR-A) protein levels in hippocampus and cerebellum of Alzheimer diseases (AD) and mild cognitive impairment (MCI) subjects. Brain samples of hippocampus (panels A and B) and cerebellum (panels C and D) of subjects with AD or MCI were assayed for BVR-A by Western Blot as described under Materials and Methods (section 2.4). Densitometric values shown in the histograms are given as percentage of Control, set as 100%, and are the product of the band value of the levels of BVR-A normalized per β-actin as loading control. In panels A-D representative gels are shown. Data are expressed as mean ± SD of six individual samples per group. *P < 0.05 and **P < 0.01 versus Control (Student's t-test).

