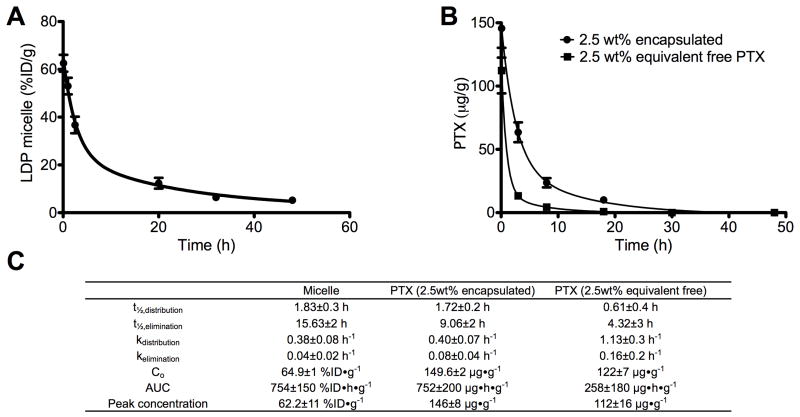
Figure 2.
Blood circulation profiles of targeted micelle (A) and PTX (B) in encapsulated and free form for non-tumored BALB/c mice (mean±SEM, n=3-5). The two-phase log-linear decrease in concentration is fitted to a two compartment pharmacokinetic model: C = Ae-αt + Be-βt. (C) Definitions: α: elimination half-life; β: distribution half-life; A: rate of loss from blood to peripheral tissue; B: rate of loss from peripheral tissue to blood; C: concentration in blood after injection; AUC, area under the curves from zero to infinity. Data is reported as percentage injected dose/gram of blood (%ID/g) for micelle and microgram of PTX/gram of blood (μg/g) for PTX.

