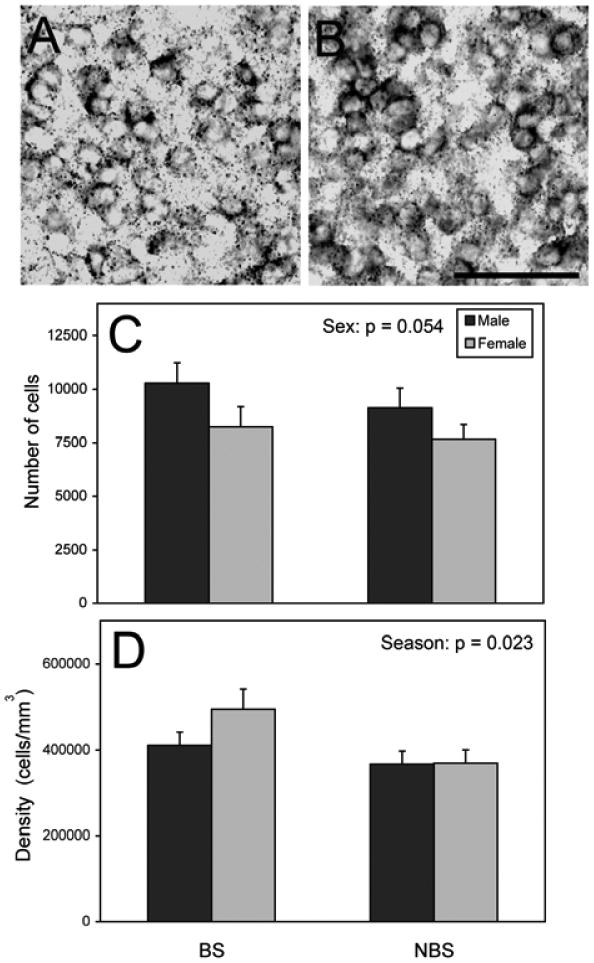
Figure 1.

Aromatase expression in the POA (mean + S.E.). The photograph in panel (A) depicts a BS male, and (B) shows a NBS male. Panel (C) indicates the number of aromatase expressing cells; (D) shows the increased density of aromatase expressing cells overall in the BS compared to NBS. Scale bar = 50 μm. = 9 NBS females, 8 for the rest of the groups.
