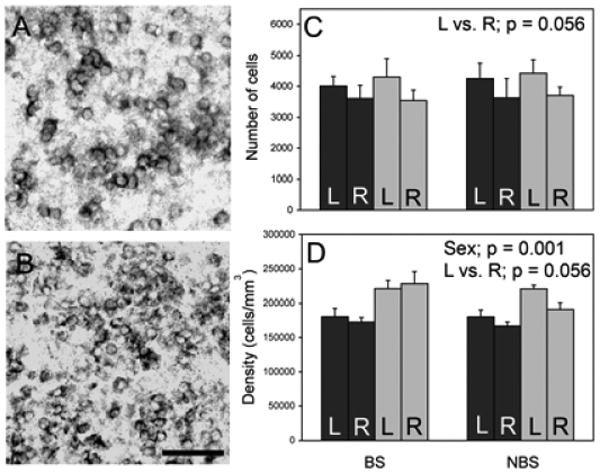
Figure 2.

Aromatase mRNA in the AMY. Panel (A) is from the left AMY of a male. Panel (B) shows the left AMY of a female. Breeding animals are represented in all panels. Mean + SE of the number of aromatase expressing cells is indicated in (C). The density of aromatase expressing cells is in (D). Scale bar = 50 μm. n = 5 BS and NBS males, 6 BS females, and 8 NBS females. Black bars = males; grey bars = females.
