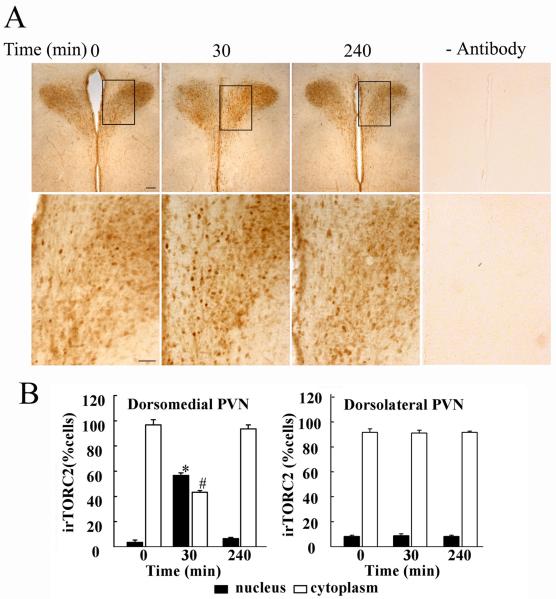
Fig 2.
Immunohistochemical staining for TORC 2 in hypothalamic sections from control rats (basal), 30 min restraint and 3h after 1h restraint (240 min) (A). As shown by the higher magnification of representative images in the lower panels, there is an increase in nuclear staining for TORC 2 following 30 min restraint. Replacing the TORC 2 antibody by non-immune globulin yielded no staining over the background. The quantitative analysis of the number of cells showing nuclear and cytoplasmic staining in the dorsomedial and dorsolateral regions of the PVN is shown in B. Bars represent the mean and SE of measurements expressed as percent of cytosolic and nuclear location per total number of cells were counted in each animal in 3 rats. *, p<0.01 higher than nuclear staining in basal (time 0), or 3h after termination of 1h stress (240 min). #, p<0.01 lower than cytoplasmic staining in basal, or 3h after termination of 1h stress (240 min).

