
Figure 6.
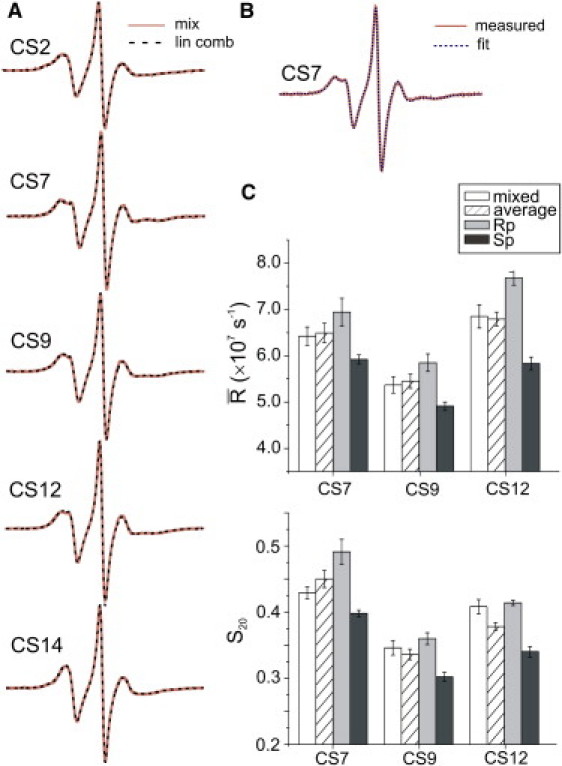
(A) Comparisons between measured spectra of R5a attached to mixed diastereomers (solid orange lines) and those computed by weighted average of the individual Rp- and Sp-R5a spectra (dashed black lines). All spectra were measured at 5°C. (B) An example of a mixed-diastereomer spectral simulation. (C) Comparisons of motional parameters obtained from fitting experimental spectra of mixed diastereomers (open bars), Rp (gray bars) and Sp (black bars). Weighted averages of Rp and Sp parameters (hatched bars) are also included.