
Figure 4.
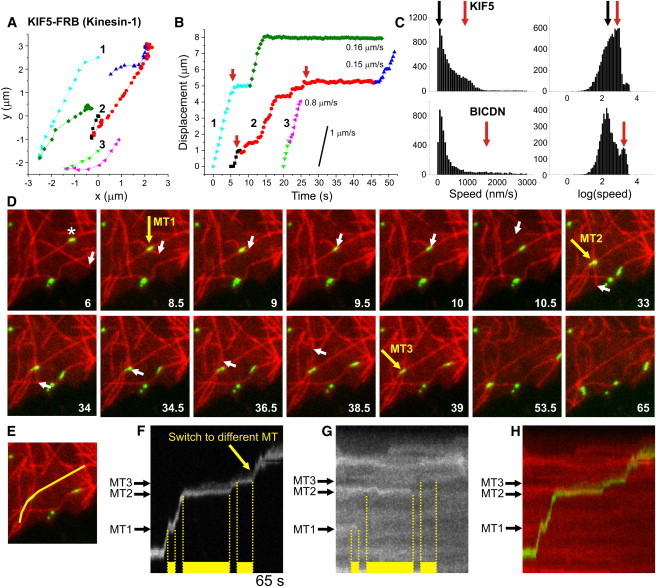
Tracing individual peroxisomes driven by specific motors. (A) Three example traces of KIF5-driven peroxisome motility. Particles often change direction by switching to a different microtubule, marked by a color change. (B) Displacement curves for the traces in A, obtained by projecting the (x,y)-coordinates onto a second- or third-order polynomial fit to the colored segments. Peroxisomes move unidirectionally over microtubules and often pause before switching to a different microtubule (marked by red arrows). (C) Histograms of instantaneous speeds for motile peroxisomes (final displacement > 1 μm) driven by KIF5 (top) or dynein (bottom). Instantaneous speeds were calculated (without sign) from the distance between consecutive (x,y) positions. The first peaks (at ∼100 nm/s, marked with black arrows) correspond to nonmotile episodes with positional fluctuations of ∼30 nm (Δt = 0.3–0.4 s). Red arrows indicate the average speed of unidirectional runs. N = 8837/5418 intervals from 533/251 trajectories for KIF5 and dynein, respectively. (D) Stills from a time-lapse recording of Kif5-driven GFP-tagged peroxisome (green) motility over microtubules (red). Yellow arrows mark three different microtubule intersections that induce pausing of the peroxisome marked with an asterisk. Motility resumes upon depolymerization of either microtubule, as evident from the white arrows that track the microtubule end. (E) Line used to generate the kymograph in panel F. (F) Kymograph showing peroxisome motility along the line shown in E. Yellow bars mark pauses induced by microtubule intersections. Unbuckling of the crossing microtubule at 9.5 s causes peroxisome deformation and apparent backward motility. (G) Kymograph of tubulin along the line shown in E reveals that the pause ending at intersections 1 and 2 coincides with depolymerization of the crossing microtubule. (H) Color merge of kymographs shown in F and G.