
Figure 3.
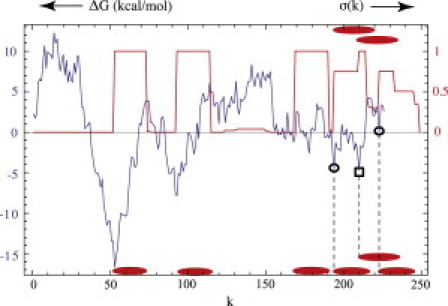
Occupancy plot for the randomly shuffled bR sequence at μ = 0.57 kcal/mol overlaid on the hydropathy plot for kBT set at 0.1 kcal/mol. (Bottom row of ellipses) Structure of the 5-TM segment ground state. (Circles) Locations of the last two segments. The minimum at k = 210 (square) is blocked in this structure. (Top) Two alternative placements of the last segment in the two competing 4-TM segment states. The occupancy plot is the superposition of these three nearly degenerate states.