
Figure 3.
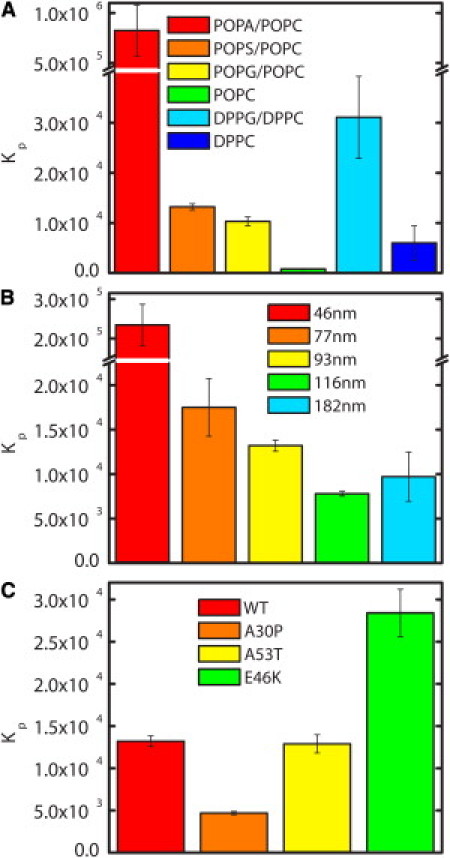
Molar partition coefficients (Kp) of αS. Comparison of Kp values measured for (A) WT αS with 93 nm LUVs of six different lipid compositions, (B) WT with 1:1 POPS/POPC vesicles covering a range of diameters, and (C) WT and disease-associated αS mutants with 93 nm 1:1 POPS/POPC vesicles.