
Figure 2.
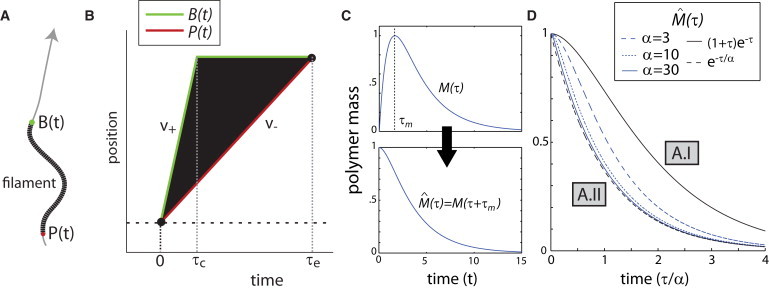
Slow pointed-end shrinkage generates exponential polymer mass decay. (A) Model diagram showing the actin filament (black), its barbed end B(t) (green), pointed end P(t) (red), and the coordinate system (gray line) with the arrow pointing toward the positive direction. (B) Treadmilling-based model of filament turnover. B(t) (green) and P(t) (red), respectively, give the positions of the barbed end and the pointed end as a function of time. The parameters v+ and v–, respectively, give the velocities of barbed-end growth and pointed-end shrinkage. The expressions τc and τe, respectively, give the time to stoppage of barbed-end growth and time to filament elimination. (C) The polymer mass time evolution curve (4) and polymer mass decay curve (5), shown here for α = 3. (D) Polymer mass decay curves (5), plotted for different values of α = v+/v–. Model regimes (A.I and A.II) are labeled in gray boxes.