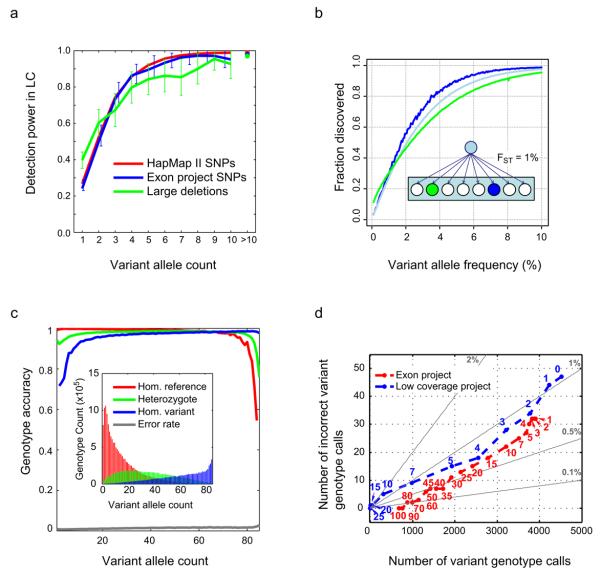
Figure 2. Variant discovery rates and genotype accuracy in the low coverage project.
a, Rates of low coverage variant detection by allele frequency in CEU. Lines show the fraction of variants seen in overlapping samples in independent studies, that were also found to be polymorphic in the low coverage project (in the same overlapping samples), as a function of allele count in the 60 low coverage samples. Note that we plot power against expected allele count in 60 samples, e.g. a variant present in, say, 2 copies in an overlap of 30 samples is expected to be present 4 times in 60 samples. The crosses on the right represent the average discovery fraction for all variants having more than 10 copies in the sample. Colours correspond to: (red) HapMap II sites, excluding sites also in HapMap 3 (43 overlapping samples); (blue) exon project sites (57 overlapping samples); (green) deletions from Conrad et al.20 (60 overlapping samples; deletions were classified as “found” if there was any overlap). b, Estimated rates of discovery of variants at different frequencies in the CEU (blue), a population related to the CEU with Fst = 1% (green) and across Europe as a whole (light blue). The insert shows a cartoon of the statistical model for population history and thus allele frequencies in related populations where an ancestral population gave rise to many equally related populations, one of which (blue circle) has samples sequenced. c, SNP genotype accuracy by allele frequency in the CEU low coverage project, measured by comparison to HapMap II genotypes at sites present in both call sets, excluding sites that were also in HapMap 3. Lines represent the average accuracy of homozygote reference (red), heterozygote (green) and homozygote alternative calls (blue) as a function of the alternative allele count in the overlapping set of 43 samples, and the overall genotype error rate (grey, at bottom of plot). The inset shows the number of each genotype class as a function of alternative allele count. d, Coverage and accuracy for the low coverage and exon projects as a function of depth threshold. For 41 CEU samples sequenced in both the exon and low coverage projects, on the x axis is shown the number of non-reference SNP genotype calls at HapMap II sites not in HapMap 3 that were called in the exon project target region, and on the y axis is shown the number of these calls that were not variant (i.e., are reference homozygote and thus incorrectly were called as variant) according to HapMap II. Each point plotted corresponds to a minimum depth threshold for called sites. Grey lines show constant error rates. The exon project calls (red) were made independently per sample, whereas the low coverage calls (blue), which were only slightly less accurate, were made using LD information that combined partial information across samples and sites in an imputation-based algorithm. The additional data added from point “1” to point “0” (upper right in the figure) for the low coverage project were completely imputed.

