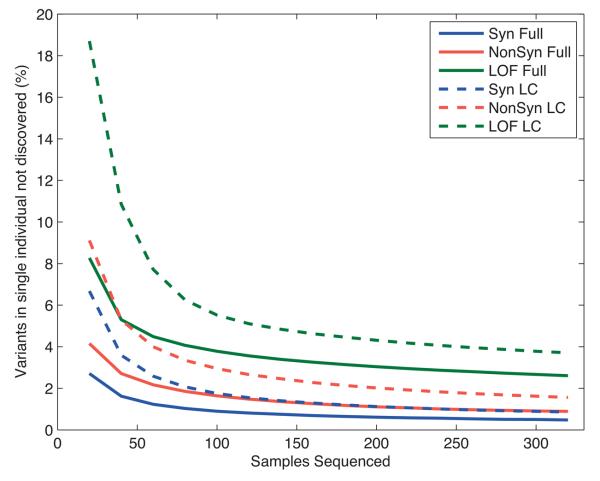
Figure 3. The value of additional samples for variant discovery.
The fraction of variants present in an individual that would not have been found in a sequenced reference panel, as a function of reference panel size and the sequencing strategy. The lines represent predictions for Synonymous (Syn), Nonsynonymous (NonSyn), and Loss of function (LOF) variant classes, broken down by sequencing category: full sequencing as for exons (Full) and low coverage sequencing (LowCov). The values were calculated from observed distributions of variants of each class in 321 East Asian samples (CHB, CHD and JPT populations) in the exon data, and power to detect variants at low allele counts in the reference panel from Figure 2a.

