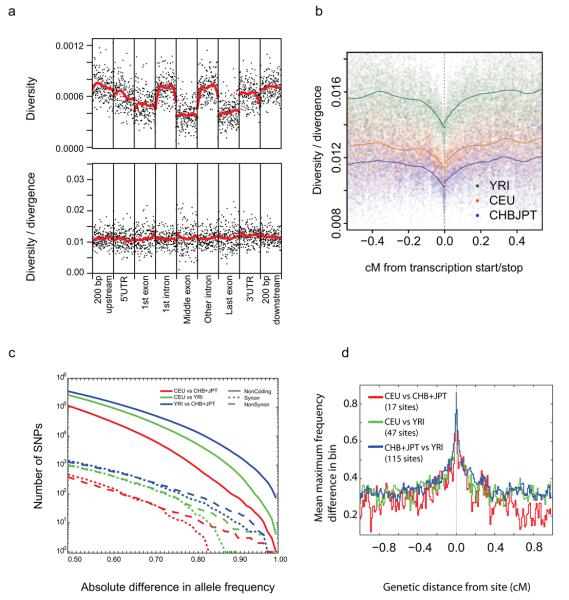
Figure 5. Variation around genes.
a, Diversity in genes calculated from the CEU low coverage genotype calls (upper) and diversity divided by divergence between humans and rhesus macaque (lower). Within each element averaged diversity is shown for the first and last 25 base pairs, with the remaining 150 positions sampled at fixed distances across the element (elements shorter than 150 base pairs were not considered). Note that estimates of diversity will be reduced compared to the true population value due to the reduced power for rare variants, but relative values should be little affected. b, Average autosomal diversity divided by divergence, as a function of genetic distance from coding transcripts, calculated at putatively neutral sites, i.e., excluding phastcons conserved noncoding sequences and all sites in coding exons but four-fold degenerate sites. c, Numbers of SNPs showing increasingly high levels of differentiation in allele frequency between the CEU and CHB+JPT (red), CEU and YRI (green) and CHB+JPT and YRI (blue). Lines indicate synonymous variants (dashed), nonsynonymous variants (dotted) and other variants (solid). The most highly differentiated genic SNPs were enriched for nonsynonymous variants, indicating local adaptation. d, The decay of population differentiation around genic SNPs showing extreme allele frequency differences between populations (difference in frequency of at least 0.8 between populations, thinned so there is no more than one per gene considered). For all such SNPs the highest allele frequency difference in bins of 0.01 cM away from the variant was recorded and averaged.

