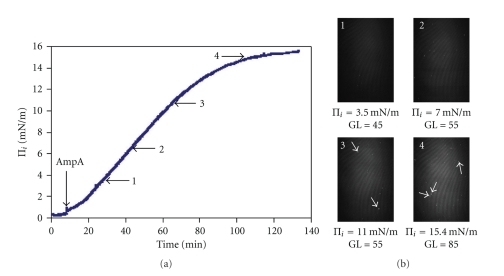
Figure 1.
Adsorption of AmpA at the air/water interface. (a) Adsorption isotherm (surface pressure Πi versus time) of AmpA at the air/water interface. AmpA was injected at a total concentration in the subphase of 250 nM. (b) Brewster angle microscopy images at the air/water interface recorded at the timepoints indicated by the numbered arrows in (a). GL: gray levels obtained with a shutter speed of 50 s−1. Arrows on photographs point to the peptide aggregates.

