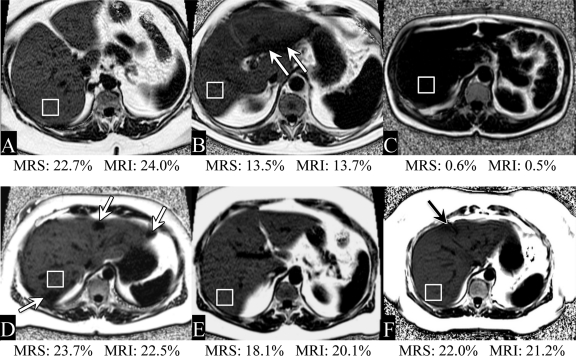
Figure 3:
Representative examples of fat fraction images obtained with MR imaging in six patients. Fat fractions obtained with MR imaging (MRI) and MR spectroscopy (MRS) are also shown. There was good subjective agreement between MR imaging and MR spectroscopy (performed in the ROI drawn in the posterior segment). A wide range of fat fractions was experienced in this patient population. In addition, many patients had heterogeneous fat (eg, areas of focal sparing [arrows]).

