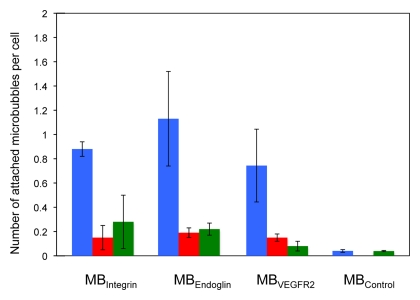
Figure 3:
Bar graph summarizes binding of MBIntegrin, MBEndoglin, MBVEGFR2, and MBControl to positive cells (blue) and negative control cells (red). Binding of targeted MBs to positive cells was substantially decreased following administration of blocking antibodies (green) but did not substantially change for negative control MBControl. Error bars = standard deviations.

