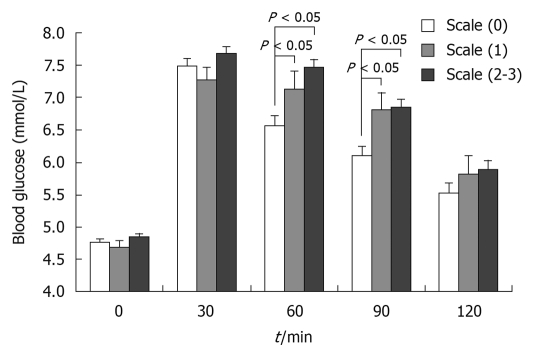
Figure 2.
Oral glucose tolerance test in obese patients based on liver B-ultrasound gradings. When patients were stratified according to the presence of liver fatty infiltration based on the B-ultrasound scans, their glucose levels at 60 min and 90 min after tolerance were significantly higher in classes 1-3 (P < 0.05) than in class 0, but there was no difference between class 1 and classes 2-3 (P > 0.05).

