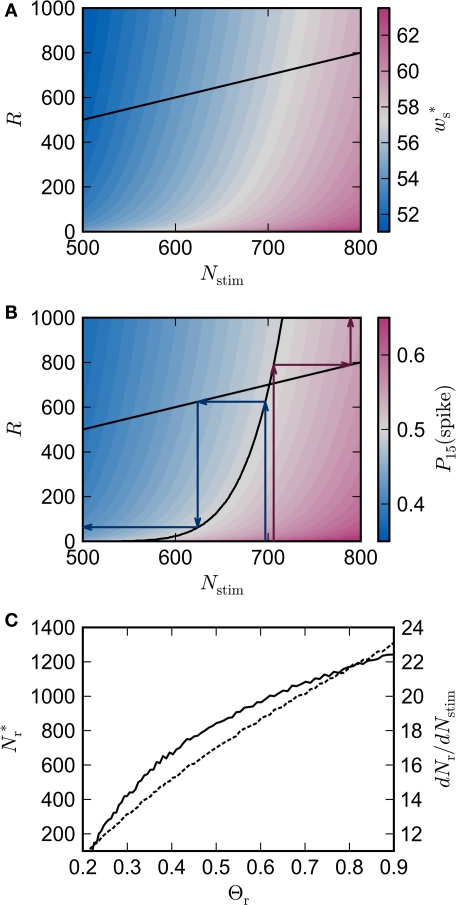
Figure 3.
Distribution of fixed points and likelihood of responding to synchronous stimulus. (A) Average strength of synapse from the stimulated group as a function of the size of the stimulated group (horizontal axis) and the connectivity rank of the post-synaptic neuron (vertical axis). The black line indicates the group of highest connectivity equal in size to the stimulated group (R = Nstim). (B) Expected number of spikes emitted by the post-synaptic neuron in the 15 ms following a synchronous spike in the stimulated group; axes and black line as in (A); the black curve indicates the number of neurons which respond to a synchronous event with a spike with probability greater than or equal to the recruitment threshold Θr = 0.5. The black line and curve represent a return map for the development of feed-forward structure in a network with an unstable fixed point at Nstim = 701. The blue arrows show two iterations of the return map for an initial stimulated population of size Nstim = 697; the pink arrows show one iteration for Nstim = 706. (C) Location and nature of the fixed point as functions of the recruitment threshold Θr. Dashed curve: fixed point , solid curve: slope of the tangent to the Nr (Nstim) curve at .

