
Fig. 6.
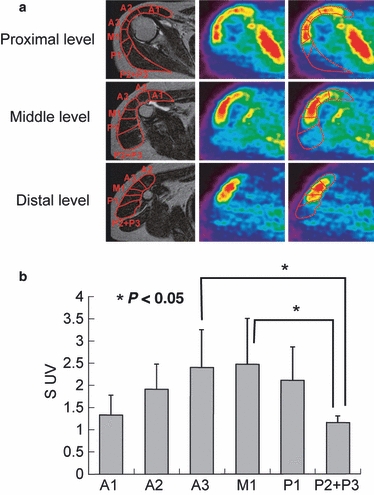
(a) Axial MRI and PET images of the proximal, middle and distal levels of the deltoid. At proximal level, the segments divided on MRI well correspond to the dotted FDG intake pattern in the PET images. (b) SUVs of each segment. The standardized uptake values (SUVs) of A3 and M1 are relatively higher than that of other segments. Especially, both A3 and M1 activities were significantly greater than that of P2 + P3 (P< 0.05).