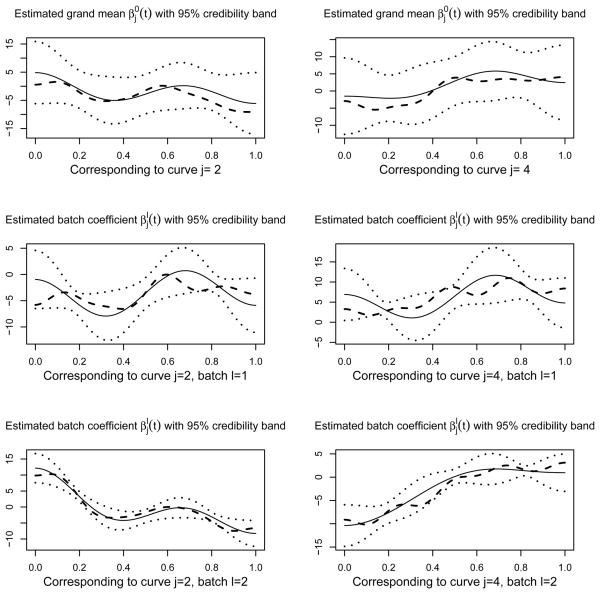
Figure 2.
The posterior estimation of the non-zero coefficient functions and their 95% simultaneous credibility band, compared with the true coefficient functions used to generate the data. Here j is the the index for mutiple functional predictors, and l is the index for batch. 's are the grand means of all batch coefficients. The solid lines denote the posterior mean; the dotted lines denote the 95% credibility bands; the dashed lines denote the true coefficient functions. We only listed the estimations for j = 2, 4 since the functional predictors at j = 1 and 3 are unselected and thus the associated coefficient estimations are close to zero.

