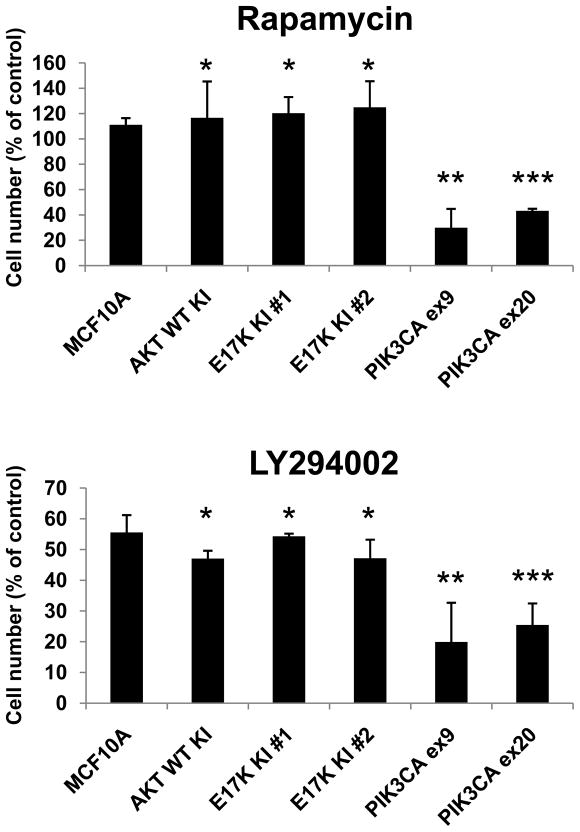
Figure 5. PIK3CA mutants, but not AKT1 mutants, display increased sensitivity to rapamycin and the PI3K inhibitor LY294002.
Cells were seeded in triplicate wells on day 0 in medium containing 0.2 ng/ml EGF. Drugs or vehicle (DMSO) were added on days 1 and 4. Cells were harvested and counted on day 6. Values are shown as percentage of vehicle control cell number and represent averages of three independent experiments with standard deviations. * p=NS compared to MCF10A. ** p < 0.02 compared to MCF10A. ***p < 0.005 compared to MCF10A.

