
Figure 2.
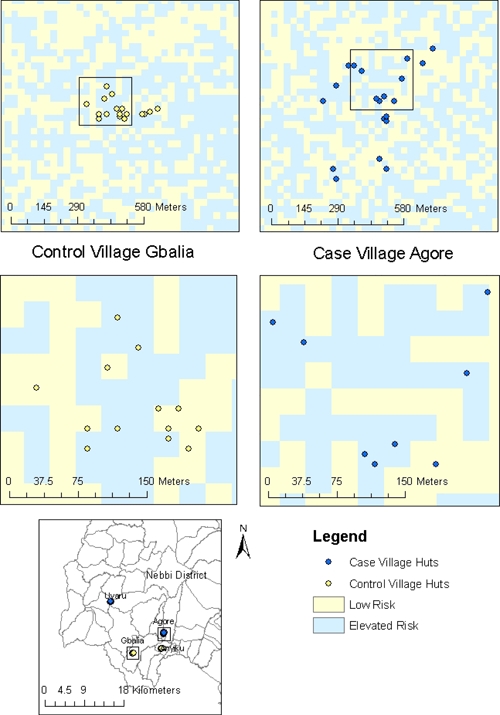
Predicted heterogeneity of pixels classified as elevated risk or low risk observed within case and control villages. The light blue-shaded regions represent pixels classified as elevated risk based on model extrapolation by Eisen and others.12 The regions shaded light yellow represent low risk.