Figure 4.
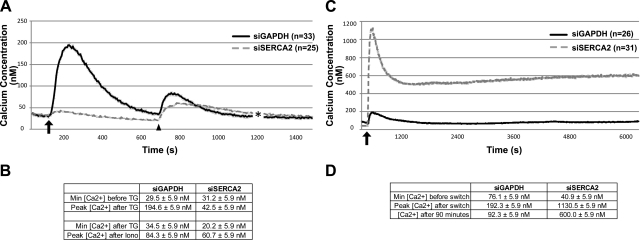
Loss of SERCA2 depletes ER calcium stores and induces a sustained elevation of intracellular calcium following a calcium switch in SCC9 cells. Intracellular calcium concentrations were determined in SCC9 cells transiently transfected for 72 h with siRNA targeting either GAPDH (solid black line) or SERCA2 (dashed gray line). A) ER calcium levels were determined by treating cells cultured in low-calcium medium with 1 μM thapsigargin gray to induce the release of ER calcium stores; arrow indicates time of thapsigargin addition. To ensure ER stores were depleted in the SERCA2-deficient cells, cells were also treated with 2 μM ionomycin to release all calcium stores; arrowhead indicates time of ionomycin addition. B) Minimum and peak Ca2+ concentrations for imaging conducted in panel A. SERCA2-deficient cells exhibit minimal Ca2+ release following thapsigargin treatment. Ca2+ release following ionomycin treatment is similar between control and siSERCA2-treated cells, suggesting that ER stores are indeed depleted by SERCA2 knockdown. C) Measurement of intracellular calcium concentration in cells during a 100-min calcium switch revealed a massive influx and sustained elevation of intracellular calcium levels in siSERCA2-treated cells (n=31) compared to siGAPDH-treated controls (n=26). Arrow indicates time of calcium switch. D) Minimum and peak Ca2+ concentrations for imaging conducted in panel C. Plots represent an average of the number of cells indicated; Error bars = means ± se.

