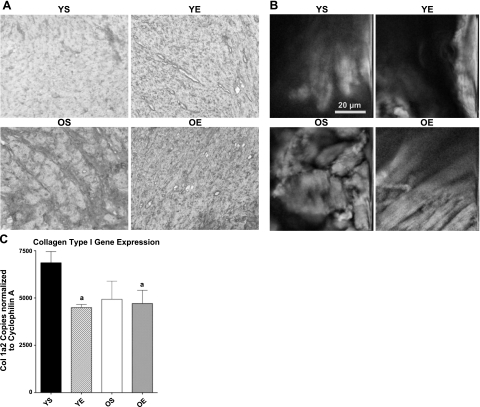
Figure 2.
A) Collagen type I-positive staining is visualized by IHC for YS, YE, OS, and OE FBNF1 rats. B) NLOM merging TPEF and SHG was used to identify collagen fibers. C) cDNA copy number of the collagen type I gene expression was measured by real-time qRT-PCR normalized to cyclophilin A. aP < 0.05 vs. YS.

