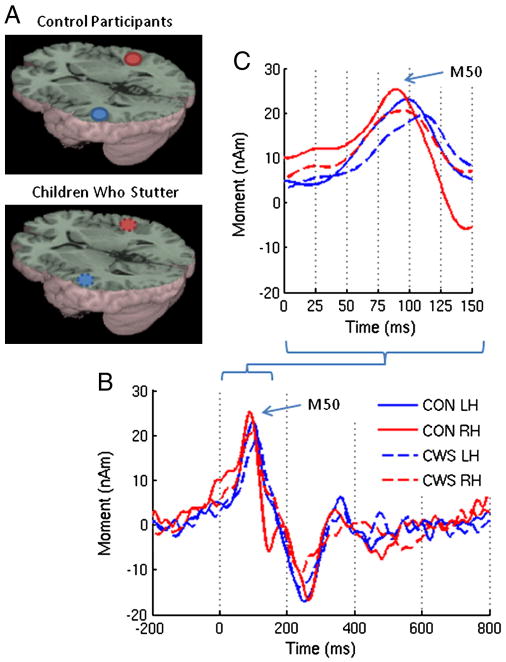
Figure 3.
(A) Group averaged source images of the auditory evoked magnetic fields for the listen vowel task overlaid on the MNI canonical brain. The associated MNI coordinates are listed in Table 2. (B) Group averaged source magnitude variations from 200ms prestimulus to 800 ms post stimulus corresponding to those sources and (C) a detailed view of the early components.

