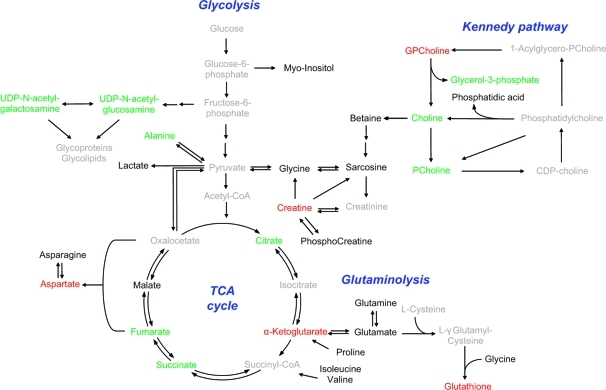
Figure 2.
Metabolic differences induced by treatment with indomethacin in acute myeloid leukemia cell lines grown in hypoxic conditions. Schematic representation of the metabolic pathways showing the most relevant metabolic changes induced by treatment with indomethacin and common to both KG1a and K562 cell lines grown under hypoxic conditions. Metabolites in green/red have significantly increased/decreased concentrations in both KG1a and K562 cell lines treated with indomethacin and grown in a hypoxic environment; metabolites in black are detected/identified in the NMR spectra but change differently or non-significantly in the two cell lines; metabolites in gray were not detected in the NMR spectra.

