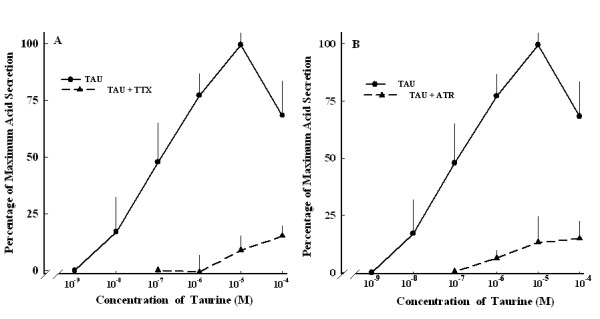
Figure 5.

Dose-dependent curve of taurine-induced acid secretion with and without atropine (A) and TTX (B). TAU, taurine alone (●, n = 6); TAU+ATR, taurine and 10-6 M atropine; (▲, n = 6). TAU+TTX, taurine and 3 × 10⁻⁷ M TTX; (▲, n = 6). Each point represents the mean ± SEM.
