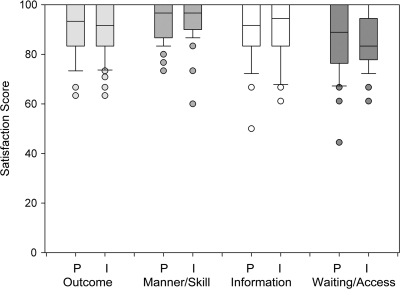
Figure 2.
Comparison of paper (P) versus Internet (I) surveys (all participants)—lower boundary of the box represents 25th percentile—line within the box represents median—upper boundary of the box represents 75th percentile—whiskers above and below the box represent 90th and 10th percentiles, respectively—points represent outliers.

